$CRV Reversal setup...Bounced off of solid support multiple times and now printing a bullish candle reversal. Pro Blue Osc quickly turning before zero line, MACD looking to cross up and RSI turning Bullish. Note: This DeFi token has 90% of supply in lock up so it can fly. $7+
CRVUSD trade ideas

CRV (Curve Finance) - I about the Hit $4$4 Soon on 30 Min Chart
1. Conversion Line Crossed Baseline
2. Leg Span Crossed the leading Span B
3. Lead Span Crossed the Leading Span B

CRV scuffed short term outlook.This is some scuffed analysis, don't take this as financial advice!
It appears as though CRV is forming a 5-wave impulse. It has already gone finished wave 1, 2, 3, and possibly 4. *Wave 4 may still be printing*
If wave 4 is done printing, then my scuffed price target is $6.24 - $6.64. The first price corresponds to the 1.618 fib level and the second price corresponds to the top of the parallel channel.

CRV - Golden Ascending Triangle on 1 hourly ChartBTC is looking Stable. CRV HIT that $5 Mark twice and formed a nice Golden Ascending Triangle on the Hourly chart. Soon it should hit $5.30 (Resistance) and all the way to $6.
Guys Let me know if you are interested in any Coins to look into.

CRV DO or DIE in next 2 to 3 daysA clear Head and Shoulder pattern formed on CRV. TIghtly holding on to $4.65 Support. By any chance, if BTC coin drops to another leg CRV will drop to another 18% ($3.75) Strong Support Zone . If BTC hits $61K we definitely see $7 in a week or so. CRV is so undervalued. In Longterm, this has to hit $25 to $30 Min. WOJAK please short CRV. 🤞🤞🤞


CRV - BullishGiving you a look at the 5 day to show you how bullish is CRV. Making new highs and potentially closing outside the Bollinger bands on the 5-day. That implies continuation on the upside. This puppy is correcting after making recent all time highs which also means... ta da.... we soon be back in dat PRICE DISCOVERY. If you like De-Fi, you should own CRV. Not telling you what to do, just what I am thinking. Thx for listening! Happy Turkey Day! :-)

CRV Expecting 20% to 30% Gains in this week. $7 Price TargetCRV Expecting 20% to 30% Gains in this week. For every ~10% pullback, it is gaining ~20 to 30%. In this month this pattern was repeated 2 times in a row. This might hit $7 in this week. Dont Panic. Long run my PT is $20.
Note: Not financial advice.

CRV/USD Should I Sell or Hold? This analysis is for educational purposes only. The information here is not trading advice. Make your own trading decisions.
I have zoomed out on a 2-day time frame. Zooming out a little takes some of the noise out of the picture when considering selling.
A question a person should answer is: What type of trader am I? A Swing Trader is willing to take profits quicker than a Position Trader. A Position Trader is more inclined to stay with the trade as long as it meets the criteria to remain in the trade, such as staying above a key moving average. The successful trader finds a style or method, sticks with it, and then "rinses and repeats." At the least, this preserves emotional capital. An investor is in it for the long haul. This analysis is for Traders, not investors.
Next, it is helpful to think of cryptos or stocks like you would think of a runner. They can only go so far before needing a rest. Some are like sprinters; they move quickly and need pauses sooner than an endurance runner who can go for quite some time. These endurance stocks quietly move upward without a lot of excitement but are very consistent.
Stocks and cryptos form personalities. Seeing how the cryptos or stocks react at these moving averages is helpful. But, what is most intriguing is when the personality changes. For instance, crypto that likes to return to the 10-day and then take off again suddenly breaks below the 10-day. This action represents a personality change. At this point, I usually will take some or all of my profits. I can always set the alarm to get back into the trade. In my opinion, CRV needs a pause which could be drastic if the overall crypto market is pulling back. Additionally, to determine if I continue to stay in the trade, I would then consider how it reacts at the 10-day and how the overall market is acting.
Many times, crypto has several sprints before pulling back. The more sprints, the more likely they are to need time to rest before taking off again. CRV/USD has had three sprints. It could have a couple of sprints left before needing a pause, but I am likely to take some profits after three.
In the case of the crypto market with less well-known names, I am a Swing Trader. I see CRV/USD has had three sprints. At this stage, I am most likely going to take some profits.
What if it goes higher and I miss out on the profits? This is where FOMO rears its ugly head. As traders, we must discipline ourselves to avoid FOMO, which has many faces. The first is buying extended names, and the second is being afraid of missing out on future profits. Sometimes I will purposely take a profit early to train myself to let go of what happens after I exit, which is not my concern unless I plan to re-enter the trade at some point.

CRV/USD long term overview.Here be have CRV/USD long term overview. RSI on monthly entered bull positive zone. Weekly RSI controlled by bullish sentiment. Overall positive trend of DeFi development puts CRV at the center of the stage. Most of coin supply is locked for long period of time. CRV is looking to have a major run and possibly return to previous ATH of $54, that represents over 900% in profit.
Let’s do this! Glta.

The right choice
The crv recommended yesterday rose well
There is still a lot of room for upside
I suggest you hold it

CRV breaks pressure againcrv forms a bullish bull flag
It is recommended to call back and build positions in batches
I expect it to have a lot of upside

CRV: ONE BULLISH LOOKING CRYPTOCRV :
Big base/ kind of cup and handle style pattern.
Broke big resistance.
Came to retest the resistance which is now a suppor t.
Also currently sitting on 50 EMA.
Ready for bullish continuation if 3.75 holds.
Target Fibs and cup n handle around 6.87/6.90
Trade safe!

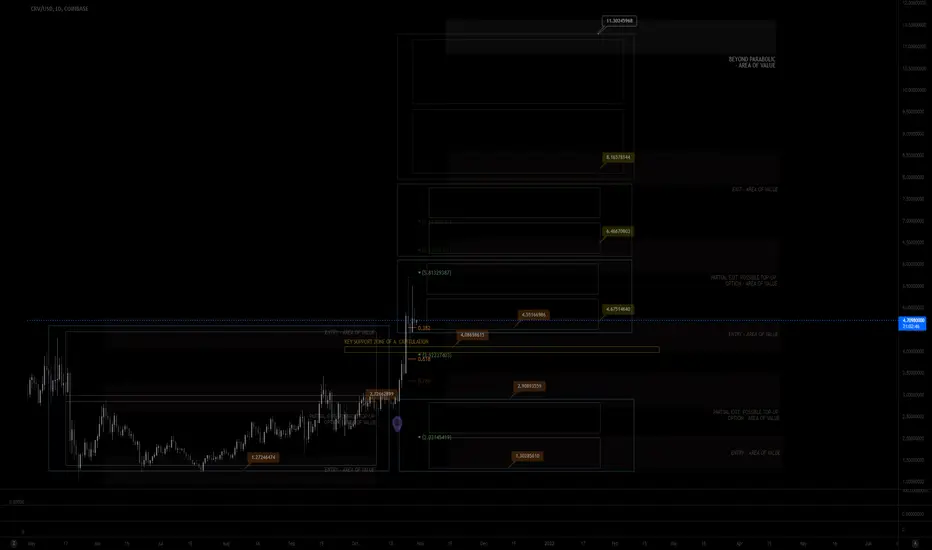
MY MINIMALIST CHART ANALYSIS FOR CURVE ALTCOIN$CRV
11.22.21
0751H +8 PACIFIC
ALERT: ADJUSTED CHART DUE TO BTC's CORRECTION
TOP-UP AREA OF VALUE HAS MOVED DOWN, THIS WILL BE A GOOD BUY FOR US
Disclaimer:
The findings of the following analysis are the sole opinions of the publisher of this idea and should not be taken as a piece of investment advice.
The Market has amazingly moved along the TOPS and BOTTOMS of our BOXES, signifying TURNING POINTS of PRICE ACTION.
JUST DYOR ENTRIES. Watch for Price action/ RSI and STOCH, VOLUME, and FIBS. Set your tight stop loss as any geopolitical, natural/man-made calamities will change the course for our TARGET AREAS OF VALUES.
REMINDER: "FOLLOW THE WHITE RABBIT!"
HOW TO USE THIS MINIMALIST CHART (You can CLICK AND hold THE CHART and PAN or DRAG IT.)
INDICATED ARE ENTRIES, PARTIAL EXITS/TOP-UPS, EXITS, and MAXIMIZED AREAS OF VALUE
Just Follow the TOPS and BOTTOMS of the BOXES as a GUIDE where the MARKET will take you.
Created on a MONTHLY, WEEKLY & DAILY Analysis (The Dynamics of the Market.)
It is designed for SWING TRADES at the BOTTOM. I do not SHORT, though, you can still use it.
TARGET ZONE IDENTIFICATION
The LARGE BOXES (Tops and Bottoms) are MAJOR pivot points that will occur sometime in the future. While the SMALL BOXES (Tops and Bottoms) are MINOR pivot points.
These can be entries to a BUY/ SELL POSITION, EXIT/PARTIAL EXIT/TOP-UP AREAS,
and, if you wish to hold longer for a MAXIMUM TARGET EXIT AREA OF VALUE - CONSERVATIVE (If price action conditions are right at that given moment.)
At times I include WAY BEYOND PARABOLIC Price TARGETS depending on The Character of the Market (CRYPTOS ONLY).
Watch out for your Volume, Chart Patterns, Candlestick Math, FIB COILS, Price Action, FIB LEVELS, Market Dynamics, especially institutional and retailer trading psychology.
Wishing you all The Best Trades and Thank you all for your Appreciation and Support of My Work.
Much thanks to My 3 Mentors. They are so much of a Blessing that I also wish to Share.
Vive Le Autist!
Vive Le Egalitarianism!

CRV is beautifulcrv completed the fundraising
And broke through the pressure zone
I believe he will rise to a high position

$CRV Bull Flag in the works on the Daily...Great setup with a token that has 90% of supply in lockup.

CRVUSDT TOP1 DEFIYou guys hate money if not in the portfolio is CRV top1 DEFI , Buy zone 3.4 - 3.7 sell 7-10-12-15-20-25-30$ Buy it the cheap hold

Curve DAO Token CRV - 2022 Crypto Portfoliocurve.fi
ALL TIME
DIP -65%
Yearly +684%
Monthly +55%
Weekly +2%
Previous ATH was $60
I hold mine via Coinbase. Here is the copy/paste overview:
Overview
Curve (CRV) is an Ethereum token that powers Curve.fi, a decentralized exchange and automated market maker protocol. The protocol is designed to make it easy to swap between ERC-20 tokens, such as stablecoins (like USDC and DAI) and Ethereum-based Bitcoin tokens (like WBTC and renBTC). In order to minimize impermanent loss, most of the protocol’s liquidity pools are made up of similar assets, although in June 2021, it introduced a USDT-WBTC-ETH “tricrypto” pool. The CRV token can be locked for various periods of time (up to 4 years) in order to vote on governance and claim protocol fees as a reward.
Currently has a sell rating of -60% but I rather buy the asset with the opposing 40%.... All i see is a heavily discounted asset for 2022 IMO
Happy Trades!

$7 PT - Pretty chart - C&HLet me know your thoughts. Looks ready to run if it can break the descending channel.
Lot of historical confluence at 4.66-4.7 which could be strong resistance.

CRV - continuationPattern is a flat with the diagonal in the wave (C).
Wave (C) is 1,618 of wave (A), that is the perfect relationship.

CRV: Accumulation Before the Next Leg UpAfter a nice run up from sub $3 up to a local high of $5.70, we can see that CRV is now accumulating in the low $4 region. If this support zone holds, then I'd expect a nice leg up in the next few weeks.
If it dumps below the support zone, this idea is delayed.
This is not financial advice. These are just my ideas and opinions.

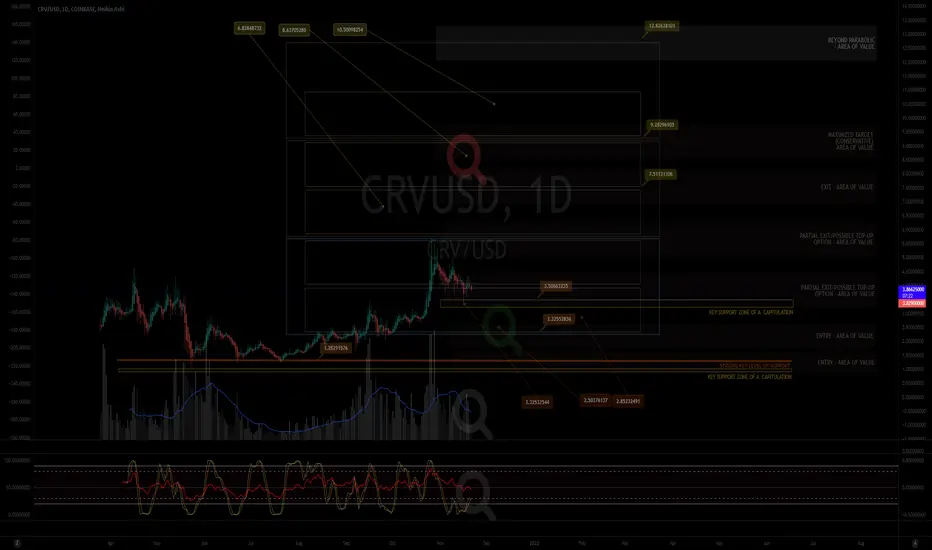
MY MINIMALIST ANALYSIS FOR CURVE $CRV
10.30.21
1050H +8 SINGAPORE
ADJUSTED CHART
ALERT: ENTRIES, PARTIAL EXITS, EXITS, and MAXIMIZED AREAS OF VALUE
INDICATORS INCLUDED
AN AREA OF OPPORTUNITY: 1ST SWING ACHIEVED
ZONE FOR AN ENTRY (COILING UP FOR A NEXT SWING.)
Since CURVE is new, I have very little data to fully understand the Market's Character. This affects accuracy.
I will research more on its FUNDAMENTALS for some confluence to my BIAS.
Wishing you all The Best Trades! Thanking you all for your Appreciation and Support of My Work.
Much thanks to My 3 Mentors!
SHOUT-OUT to All the Cryptoverse Analysts!
Vive Le Austist! Vive Le Retailers! Vive Le Revoluzion!
Disclaimer:
The findings of the following analysis are the sole opinions of the publisher of this idea and should not be taken as a piece of investment advice.
"FOLLOW THE WHITE RABBIT!"
HOW TO USE THIS MINIMALIST CHART
Created on a MONTHLY, WEEKLY & DAILY Analysis (The Dynamics of the Market.)
It is designed for SWING TRADES at the BOTTOM. I do not SHORT, though, you can still use it.
TARGET ZONES IDENTIFICATION
The LARGE BOXES (Tops and Bottoms) are MAJOR pivot points that will occur sometime in the future. While the SMALL BOXES (Tops and Bottoms) are MINOR pivot points.
These can be entries to a BUY/ SELL POSITION, EXIT/PARTIAL EXIT/TOP-UP AREAS
and if you wish to hold longer for a MAXIMUM TARGET EXIT AREA OF VALUE -CONSERVATIVE (If price action conditions are right.)
At times I include WAY BEYOND PARABOLIC Price TARGETS depending on The Character of the Market.
Watch out for your Volume, Chart Patterns, Candlestick Math, Price Action, Fibs, Market Dynamics, and especially trading psychology.
Note: This CHART is best used without indicators.
Master your Trading Discipline
and Trader's Psychology