CRV Bullish CountCRV Bullish Count
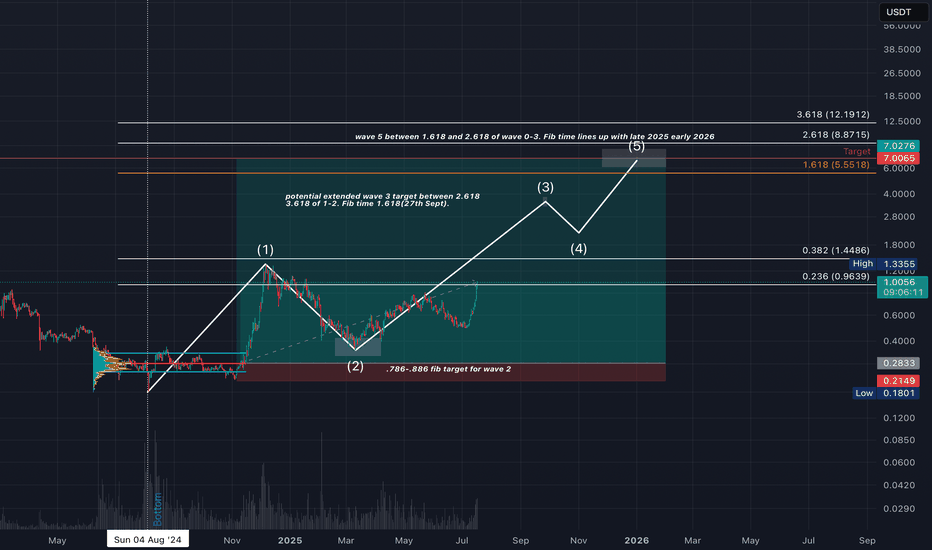
Longer-term Elliott Wave count using trend-based fib time/price projection for CRVUSDT.
Macro bottom identified in August 2024 — entry taken off the bottom range POC retest (pic). Holding for a full 5-wave structure because… why not. Partial profits taken at the potential Wave 1 top.
Wave 1: $0.1801 → $1.33
Wave 2 retrace: to $0.3471 (between 0.786 and 0.886 fib levels)
Wave 3 (current): Targeting between $3.20 and $3.60 (extended Wave 3 scenario).
Fib time 1.618 from Wave 1–2 aligns with Sept 27th — likely Wave 3 top.
Wave 4 retrace: Expected between 0.236–0.382 of Wave 2–3
Wave 5 projection: 1.618–2.618 extension of Wave 0–3 = $5.50–$7.00
Possibly higher with full-blown euphoria.
Fib Time Projection for Wave 5 Completion:
→ Earliest: Late Dec 2025
→ Latest: July 2026
But what is 6–7 months in crypto…
Remember, it's a bullish long term count. It could play out, or fade to nothing depending on market conditions
CRVUSDT trade ideas
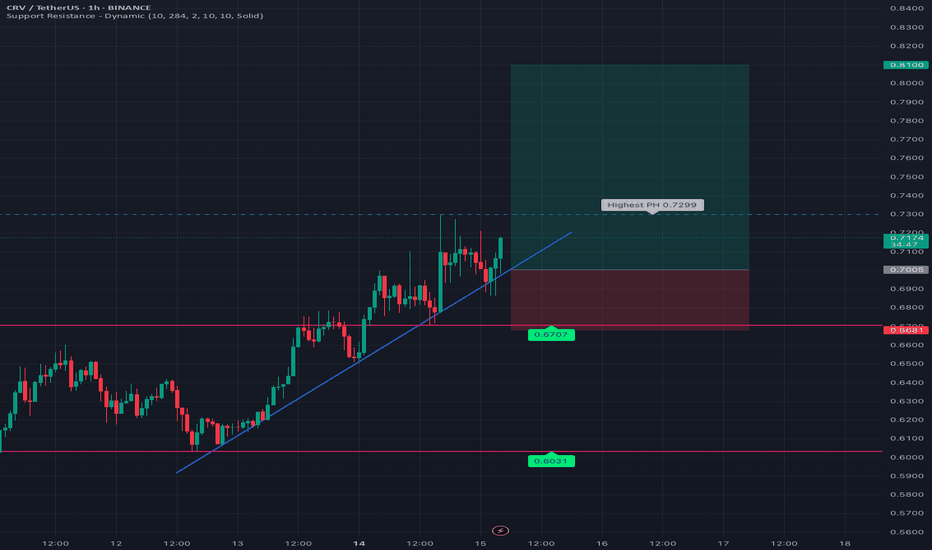
$CRV Macro Bearish PlayWe had an inverse cup and handle at .6266 that broke down to .50 and didn't meet its target (.40-.42 area). Instead, we consolidated at .50 to expand the smaller inverse cup neckline to .5503. This move up from .50 to .73 (currently) is a slighty over extended handle. If we continue higher but fail to establish support @ .8231, the next bearish structure is a double top with its peaks finding resistance around .82-.86 and neckline @ .5385. The rest is self-explanatory in the chart.
CRVUSDT - Swing Spot Trade RecommendationCRVUSDT - Swing Spot Trade Recommendation
Entry: Current price at $0.55
Targets: $0.83 - $1.40 - $1.80
Strategy: Follow and take profits at W's peak.
Rationale: Monthly trend (M) remains bullish. Weekly timeframe (W) is currently in correction, forming a bottom, with potential reversal confirmation soon.
CRV ANALYSIS🔮 #CRV Analysis 💰💰
🌟🚀 As we can see that #CRV is trading in a symmetrical triangle and given a perfect breakout. But there is an instant resistance. If #CRV breaks the resistance 1 then we will see a good bullish move in few days . 🚀🚀
🔖 Current Price: $0.7280
⏳ Target Price: $1.0800
#CRV #Cryptocurrency #DYOR
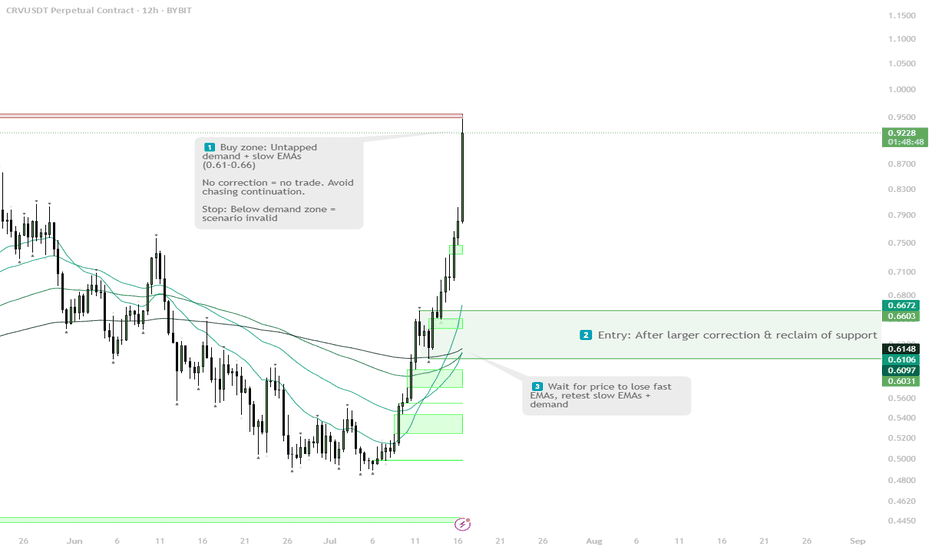
CRV - Two Scenarios for Strategic Spot BidsBINANCE:CRVUSDT
No FOMO, two clean entries.
Sweep S/R and reclaim EMA 200 — first trigger for spot longs. Equal lows at $0.61 — magnet for liquidity.
Deeper flush to demand = main buy zone ($0.40–0.56).
Stops under main demand.
Plan simple: let the market pick the entry for you.
CRV Approaching Demand — Bottom Fishing in the $0.40–$0.49 Zone🎯 BINANCE:CRVUSDT Trading Plan:
Scenario 1 (Reversal from Demand):
Look for bullish SFP, engulfing, or reclaim in $0.40–$0.49 zone
If confirmed, long with first target $0.83
Tight stop below $0.39
Scenario 2 (Breakdown):
If $0.39 breaks decisively, step aside — risk of new lows
🔔 Triggers & Confirmations:
Enter only with clear bullish trigger on LTF (H1/H4)
No trade if price grinds below $0.40
📝 Order Placement & Management:
🟩 Buy Zone: $0.40–$0.49 (alerts on wicks into zone)
🛡️ Stop: Below $0.39
🎯 Target: $0.83
🚨 Risk Warning:
Only bottom fishing with confirmation — avoid knife catching
CRV Range Reclaim — Eyes on $0.70 After Classic Deviation Setup🎯 BINANCE:CRVUSDT Trading Plan:
Active Range Setup:
Long Trigger: Deviation and reclaim below $0.5585
Target: $0.70 (mid/upper range)
Stops: Below most recent deviation
Alternative:
If $0.47–$0.50 is swept, look for LTF reversal signals for a new long entry
No Macro Shift:
Stay in range-trading mode until daily/weekly close above $0.76
🔔 Triggers & Confirmations:
Play the range: long on deviations and reclaims, take profit at range high or $0.70
Reassess for higher timeframes only after $0.70–$0.72 or $0.47–$0.50 is hit
🚨 Risk Warning:
Don’t chase mid-range — entries are only at extremes or after deviations
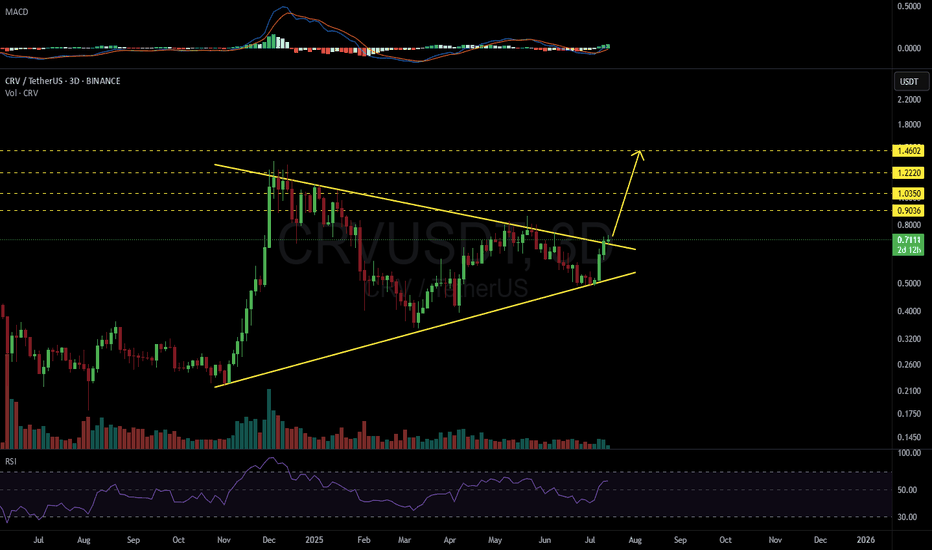
CRVUSDT 3D#CRV has broken above the symmetrical triangle on the 3-day timeframe.
If it manages to close the 3-day candle above the pattern, it could trigger a 2x bullish rally. Keep an eye on it — if confirmed, the targets are:
🎯 $0.9036
🎯 $1.0350
🎯 $1.2220
🎯 $1.4602
⚠️ Always use a tight stop-loss and apply proper risk management.
CRV ANALYSIS (1D)The smaller structure of CRV is bearish. It is expected to reject downward from the red zone, with our rebuy zone being the green area.
Given that the internal structure is bearish, it is ultimately expected to reach the green zone.
Closing a daily candle below the invalidation level will invalidate this analysis.
For risk management, please don't forget stop loss and capital management
When we reach the first target, save some profit and then change the stop to entry
Comment if you have any questions
Thank You
CRV/USDT | Long | DeFi Utility | (June 24, 2025)CRV/USDT | Direction: Long | Key Reason: Pattern Reversal & DeFi Utility | (June 24, 2025)
1️⃣ Insight Summary
CRV is forming a bullish “W” at the bottom of its parallel channel, supported by value area highs, point-of-control, and structural support around $0.47–$0.55. If it flips that zone into support, a strong rebound toward $0.61 and higher looks likely.
(Note: The widget displays current price around $0.58, up ~10% in the past 24h.)
2️⃣ Trade Parameters
Bias: Long
Entry: Around $0.548 (upper “W” neckline)
Stop Loss: Below $0.47 (channel bottom & structural support)
Take Profit 1: $0.61
Take Profit 2: $0.70
Take Profit 3: $0.78
Extended Target: $0.84 (exit 50% profit)
Final Run-Up Target: $1.00
R/R ratio is around 1:7—very favorable if support holds.
3️⃣ Key Notes
✅ Technical setup: Classic double-bottom structure at channel low, supported by POC and value area high—ideal reversal base.
✅ DeFi fundamentals: CRV is the governance token for Curve Finance, a top-tier stablecoin AMM on Ethereum and L2s
✅ Robust ecosystem & growth: Consistently high TVL (~$2.6B), cross-chain deployments, governance participation, and sound tokenomics
coindcx.com
✅ Security signals: Admins resolved a front-end DNS hijack issue in May without any fund loss; founder repaid a $42M Aave loan—credibility-enhancing steps
finance.yahoo.com
⚠️ Risks: Still in a downtrend with inflationary token distribution and intense competition from other AMMs/governance tokens.
4️⃣ Follow-up Note
If CRV breaks above $0.61 with volume, I’ll reassess the trade and consider holding to the $0.84–$1.00 zone. Any drop below $0.47 invalidates the bullish setup.
Please LIKE 👍, FOLLOW ✅, SHARE 🙌 and COMMENT ✍ if you enjoy this idea! Also share your ideas and charts in the comments section below! This is the best way to keep it relevant, support us, keep the content here free and allow the idea to reach as many people as possible.
Disclaimer: This is not financial advice. Always conduct your own research. This content may include enhancements made using AI.
CRV TARGET FOR NEXT 3 MONTHS 🔥 LSE:CRV long setup (1 D) 🚀
✅ Entry Zone: $0.52 – $0.47 (Nov-24 launchpad demand)
🎯 Targets
• TP-1: $0.90 (Dec swing-high cluster)
• TP-2: $1.30 (#IPO wick fill)
⛔ Stop-Loss
Daily close < $0.40
📊 Thesis
• #crvUSD supply just hit a $179.8 M ATH 🏦
• #LlamaLend + Resupply loop turbo-charge fee flow 🔁
• #CrossCurve unifies **all** Curve liquidity across chains 🌐
• Record $35 B traded in Q1-25 — volumes ↑ 13 % YoY 📈
• < 2 % of CRV still vesting; sell-pressure near zero 🔒
• veCRV model keeps 52 % of supply time-locked & voting 🗳️
• #Stablecoin bill, #MiCA & US #RWA boom = tail-wind for #DeFi 🔥
CRV | bounce then another sweep to form a local lowLiquidity taken, now eyeing push to $0.70–0.72 local supply.
Watching for another low after that move:
• HL triple tap = bullish base
• Or final drive into $0.47–0.50 = max opportunity for R:R swing longs
Breakout only confirmed above $0.75.
Patience — best setups come after the next local low.
CRV BULLISH Q3 2025🔥 LSE:CRV long setup (1D) 🚀
✅ Entry Zone: $0.52 – $0.48 (re-test of Nov-24 launchpad base)
🎯 Targets
• TP-1: $0.90 (Dec swing high)
• TP-2: $1.30 (IPO wick fill)
⛔ Stop-Loss
Daily close < $0.44
📊 Thesis
crvUSD supply just hit a $179.8 M ATH 🏦, LlamaLend soft-liquidation markets are live, and the new Resupply loop lets users lever yields — all pushing protocol fees up while 98 % of CRV is already unlocked. Add CrossCurve’s cross-chain liquidity hub and record $35 B Q1-25 volume and the R/R is 🔥 (~5.8 R).
CRV (swing setup) — Watching Liquidity Zone ReactionBINANCE:CRVUSDT is pulling back into a key liquidity zone around $0.60–$0.55. This area acted as prior resistance and is now being retested as support. A spike into this zone with a bullish reaction could offer a strong swing entry.
Setup:
🟩 Liquidity Zone: $0.60–$0.55
Look for liquidity sweep and reversal signal within this zone. Key confluence with S/R flip and HTF demand.
🚫 Invalidation:
• Daily close below $0.50 = setup invalid
• Final defense at $0.4010 (monthly support)
🎯 First Target: $0.90+
Clear resistance above, likely to act as first take-profit zone if reversal plays out.
Plan:
• Monitor lower timeframes for entry trigger inside liquidity zone
• Favor patience and confirmation — this is a high-R setup if structure holds
📌 Classic SFP setup at support — risk defined, upside open.


