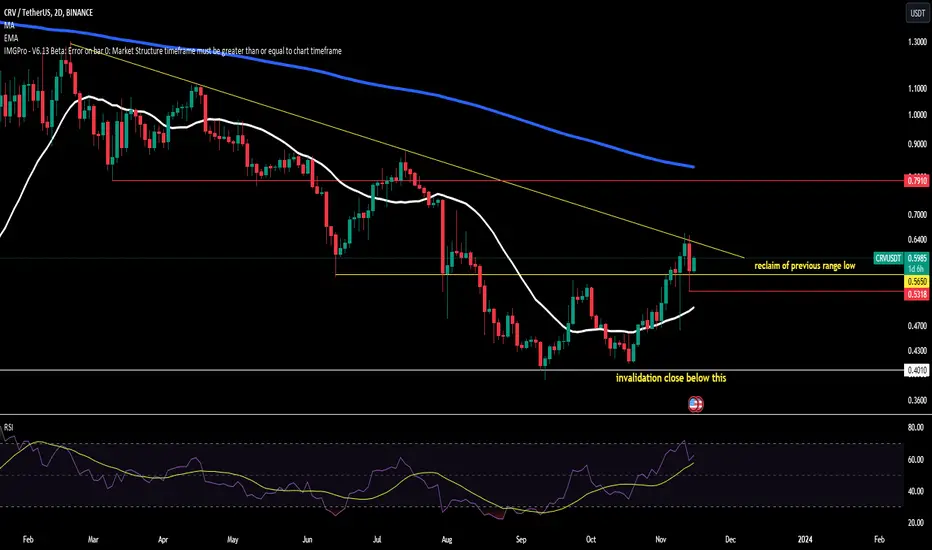
$CRVreclaimed previous range low so below that is invalidation
expecting this to do a DYDX sorta move ..
CRVUSDT trade ideas
CRV retested main trendline. Go UP!CRV breaking out on 1D a few days ago. Now it's retested the main trendline and now it's time to go up if BTC doesn't spoil the party.
This trade it takes couple of days or weeks, SL is also indicated. Risk managment is necessary!
This is not a financial advice! I make charts to myself only.

CRV: New DEFI BOOM in 2024?Exciting times are ahead for the decentralized finance (DeFi) space, and Curve DAO Token (CRV) is catching our attention with its bullish stance. The charts are painting a promising picture, and it seems like CRV is gearing up for new highs during the upcoming DeFi boom in 2024. Let's dive into the factors contributing to this bullish outlook. 📈🌐
The CRV Bullish Scenario:
Curve DAO Token (CRV) is exhibiting strong bullish signals, setting the stage for a potential uptrend. As we anticipate the next DeFi boom in 2024, CRV appears well-positioned to capitalize on the renewed interest in decentralized finance.
Technical Indicators:
Chart Patterns: CRV's chart patterns are aligning with traditional bullish formations, suggesting a positive momentum shift.
Volume Analysis: Increased trading volume is often a precursor to significant price movements. CRV's recent uptick in volume is indicative of growing interest and participation.
The DEFI Boom 2024 Catalyst:
The decentralized finance ecosystem is expected to experience another boom in 2024, driven by advancements, new projects, and increasing adoption. CRV, being a key player in the DeFi space, is likely to benefit from this overall market trend.
Anticipating New Highs:
With the convergence of bullish technical indicators and the broader DeFi market narrative, there's a strong case for anticipating new highs in CRV during the upcoming DeFi boom. Traders and investors alike should keep a close eye on developments in the DeFi space and CRV's price action.
Trading Strategy:
Technical Confirmation: Wait for additional technical confirmation, such as a breakout or sustained positive momentum, before entering a position.
Market Awareness: Stay informed about developments in the broader DeFi ecosystem, as they can influence CRV's price trajectory.
Risk Management: Implement sound risk management practices to safeguard your investments, especially in the dynamic and sometimes volatile DeFi market.
Conclusion:
As CRV sets the stage for a potentially bullish cycle, the DeFi boom in 2024 could catapult it to new highs. As always, approach the market with a strategic mindset, adapt to changing conditions, and may your trades be in sync with the rhythm of the crypto market.
❗️Get my 3 crypto trading indicators for FREE! Link below🔑


CRV elliot wave analysisHi
This is the elliot wave count for CRVUSDT
Please let me know what you think about it

Curve Finance - DailyThese are my Keylevels for CRV.
I like this chart, after a V reversal, the price printing another HH .

CRV LongBreakout on daily and testing support
Entry and Take profits on chart
TP1 take out 75% let the rest run to TP2
Lev 10-20x
Good luck

Bullish Double Bottom on CRV/USDT
Pattern: Bullish Double Bottom
Pair: CRV/USDT
Entry Point: Breakout above the neckline at 0.5376
Trade Parameters:
Entry Price: Buy once the price closes above 0.5376
Stop Loss (SL): Set the stop loss just below the neckline (approx. below 0.5376)
Take Profit (TP): Target a price level of 0.66
Rationale:
The bullish double bottom pattern, characterized by two consecutive price troughs followed by a breakout above the neckline, indicates a potential trend reversal from bearish to bullish.
We'll initiate the long position once the price closes above the neckline (0.5376), which serves as our entry trigger.
To manage risk, we'll place our stop loss just below the neckline to protect against adverse price movements.
The target price (TP) for this trade is set at 0.66, which is determined by measuring the vertical distance between the lowest point of the pattern and the neckline and adding it to the neckline's breakout point.

CRV - is looking strong with potential upside to TP3I think CRV is a great project and a close above TP1 at 0.65 will unleash very bullish move towards next targets.

CRV swing longanother alt coin swing long idea,
this is on a monthly chart so it can take time to play out but also the SL is rly wide due to the HTF chart
so small size is recommended, don't shoot yourself in the leg
NFA ! DYOR

CRV target 0.74h time frame
-
CRV is creating a double bottom structure, and facing the resistance from neckline around 0.55. This bottom structure will be completed if CRV go above the neckline, then target will be set at 0.7, which is also the resistance of long-term downtrend line.
TP: 0.68~0.75
SL: 0.456

CrvThe first resistance that can be reached are two red lines that can react to it, after crossing the red line and pullback to its area, you can think about it for higher targets in the area, $1-$1.50, if the lines If the green is broken, it must be checked again

CRV MID TERM BULLISHMany Alts have recently broken out of their trendlines, indicating a potential shift in trend.
The same goes for CRV, which has formed a double bottom on the daily timeframe and also broke out of its trendline. Based on these technical indicators, I am anticipating a mid-term bullish run for CRV, with the price potentially reaching at least $1 in the near future.

After breakingDO NOT FORGET USING A STOP LOSS
Warning:
This is just a suggestion and we do not guarantee profits. We advise you analyze the chart before opening any position.
I hope you are always profitable

💡Trade Idea #CRV/USDT:W shape pattern facing a massive resistance at this moment. This is a possible scenario for LSE:CRV to get a rally phase till the next resistance key level or supply box.

Can CRV make 500% move?CRV's Lowest point was 0.32-0.42 zone which checked in October 2020. As you can see CRV checked that area twice since then. I am gonna take profit at those marked green lines.

CRV Falling wedgeCRV UPDATE: CRV is the chart that catch our attention today…. CRV created a massive falling wedge on daily TF and is looking forward to breakout from the falling wedge resistance…. It also formed double and is currently facing the neckline resistance of the double resistance.
Is good to buy in spot here or long from here to nearest daily resistance….
Follow for more market update
Can message me for trade setup


CRV/USDT Bouncing significant, Ready to Continue Upward Move ??💎 CRV has undeniably caught our eye. It's rebounding after touching the Bullish OB zone. Observing its short-term trend, it remains predominantly bullish, evident from its consistent higher highs and higher lows.
💎 Currently, CRV seems to be forming another higher low within the Bullish OB zone, suggesting potential for further upward trajectory. The immediate target for CRV lies at the supply zone. Should CRV surpass this supply, it would pave a smoother path towards the Bearish OB zone.
💎 On the flip side, if CRV retraces downwards to test the Bearish OB and fails to maintain its position within this zone, there's a risk it might descend further to the key support level.

CRV/USDT 1-Day TF: Bullish Momentum ResurfacesBINANCE:CRVUSDT
CRV/USDT has recently shown renewed bullish momentum on the 1-day timeframe. This suggests that market sentiment is shifting, with bulls gaining control.
It is important to monitor this development closely, as it may present a favorable opportunity for traders and investors.
Traders who are bullish on CRV/USDT may want to consider taking a long position with a stop loss below the recent swing low.
Risk Management
It is important to note that all investments carry risk, and there is no guarantee of profit. It is important to do your own research before making any investment decisions, and to risk only what you can afford to lose.
Disclaimer: This is not financial advice.

CRVUSDT # 003 ( About to broken important Arc Resistance ! ) Hello dear traders .
Good days.
CRVUSDT get support for 2nd time from weekly Gann Square Fan trend line and is about try attack important Gann Arc resistance which 2 time failed .
It will move upward after broken arc resistance to test next Gann fan trend line which will be @ the end of OCT-2023 .
Good luck and safe trades.
Thanks for your support and comments.

CRV LONG TRADECRV has formed bullish div on 1D. This makes a possible flat scenario and will eventually complete the c wave when it hits .589.
