Crypto Signal TodayHello friends🙌
Given the buyers' support for the price and their entry, you can buy in steps in the specified areas with capital and risk management and move to the specified targets📈
Follow us for more signals😉
*Trade safely with us*
CRVUSDT trade ideas
CRV long "@members CRV long would need to reclaim MO lows or BTC to looks more like it will only go higher more on the risky side"

CRV BUY FROM HERECRVUSDT is looking bullish on 1H timeframe. Bullish OB+FVG area filled and green engulfing candle formation is a buy sign,

Fiery support was revealed...Hello friends
According to our technical analysis and research on this currency, we were able to find important supports for you so that you can buy on those supports in stages and with capital management.
The targets are also specified...
*Trade safely with us*

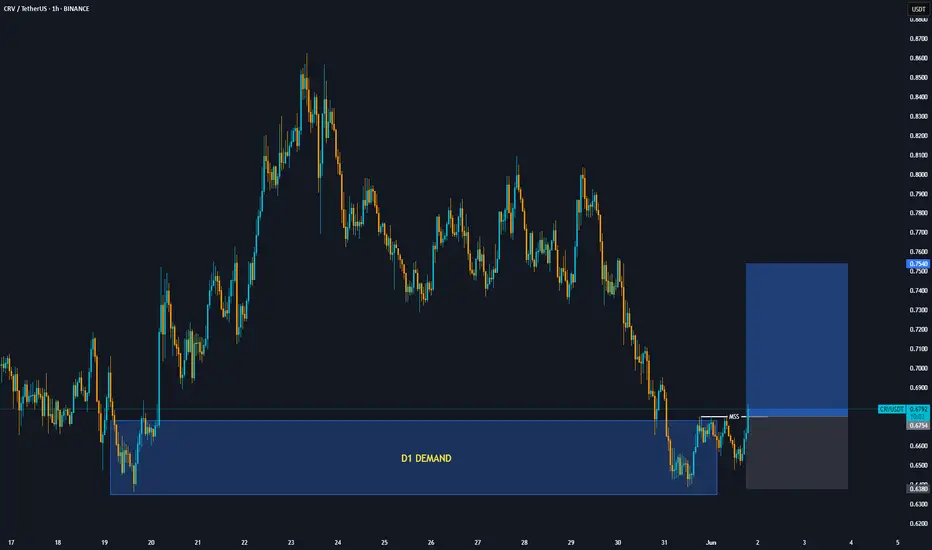
CRV D1 DEMAND LONG POSITIONThe currency is currently being rejected from the daily demand zone and has also confirmed a trend change on the 1-hour time frame. You can enter a long position with a stop loss below the last low and a take profit of twice as much.
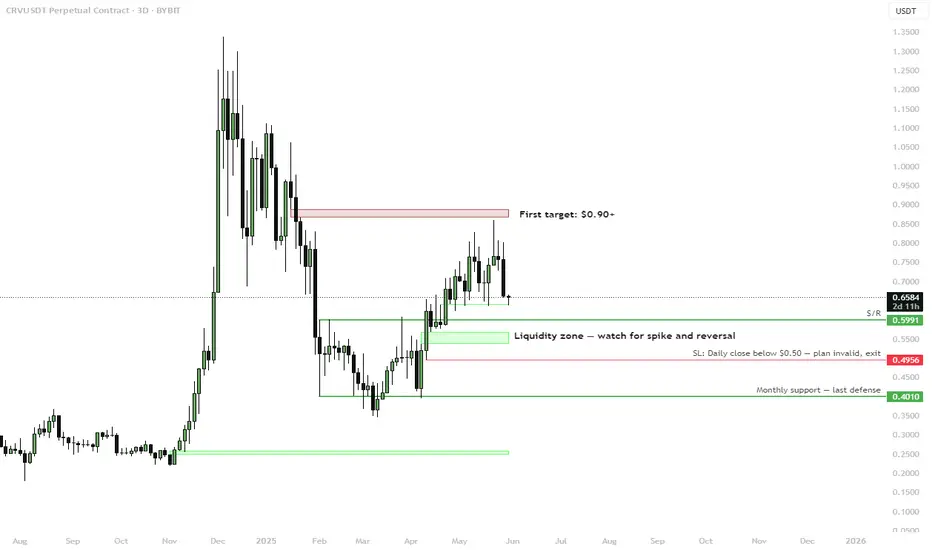
CRV (swing setup) — Watching Liquidity Zone ReactionBINANCE:CRVUSDT is pulling back into a key liquidity zone around $0.60–$0.55. This area acted as prior resistance and is now being retested as support. A spike into this zone with a bullish reaction could offer a strong swing entry.
Setup:
🟩 Liquidity Zone: $0.60–$0.55
Look for liquidity sweep and reversal signal within this zone. Key confluence with S/R flip and HTF demand.
🚫 Invalidation:
• Daily close below $0.50 = setup invalid
• Final defense at $0.4010 (monthly support)
🎯 First Target: $0.90+
Clear resistance above, likely to act as first take-profit zone if reversal plays out.
Plan:
• Monitor lower timeframes for entry trigger inside liquidity zone
• Favor patience and confirmation — this is a high-R setup if structure holds
📌 Classic SFP setup at support — risk defined, upside open.
CRV LONG SCALP🧠 Refined Trade Setup (Long)
Entry Price: ~0.6416
Stop-Loss: ~0.6350
Take-Profit Target: ~0.6943
Risk-Reward Ratio: Approximately 1:4 – high potential reward relative to risk.
🔍 Key Technical Details
Support Level: Clear and strong support at 0.6402, marked on chart.
Multiple tests of this level suggest possible bottoming or accumulation.
Trendline (Bearish): Still intact. A break above that downward-sloping red dotted line would be a bullish signal.
📈 Indicators
RSI (Middle Panel):
Currently around 39.7, still in the bearish-neutral zone.
Not oversold, but close – suggesting some room for upside if a reversal starts.
MACD (Bottom Panel):
Histogram turning lighter green = bullish momentum weakening, possibly stalling.
Signal lines (green/red) are close together, possibly coiling for a move.
⚠️ Market Context
The setup is counter-trend (going long in a downtrend), which means extra caution is required.
A bullish break of the descending trendline would add confirmation to the setup.
Current price action shows tight consolidation above support—often a precursor to a breakout or breakdown.
✅ Bullish Signs:
Multiple support touches without breakdown.
Decent reward if the trade plays out.
Potential for trendline breakout.
❌ Bearish Risks:
RSI and MACD not clearly bullish.
No current breakout confirmation.
Could be a bear flag instead of accumulation.

CRV (HTF trigger zone) — Eyes on Sweep and MSBLSE:CRV has swept into a major bullish OB cluster, entering a high time frame sweep zone where potential reversals often occur. This area aligns with previous equal lows (EQL) and liquidity pockets, creating the conditions for a HTF long setup — but only with confirmation.
Setup:
🟩 Sweep Zone: $0.64–0.68
This is the trigger area. Watch for a clean sweep and a bullish MSB on M15 or H1. If the sweep includes the EQL below, even better — deeper liquidity grab improves the setup quality.
❗ Entry only on confirmation:
• Strong candle close above
• MSB on intraday chart
• Clear reversal pattern
📌 No knife-catching — let the pattern form and confirm.
🎯 Targeting eventual reclaim of mid-range and possible revisit of $0.75–0.80 if bounce holds.

CRV – Breaking Down from Falling Wedge (4H)🔻 LSE:CRV is slipping below the falling wedge pattern on the 4H timeframe.
🛑 Key support zones to watch are $0.68 and $0.65.
⚠️ Though falling wedges often hint at bullish reversals, external pressures like CRYPTOCAP:BTC dominance are causing altcoins to bleed currently.
👀 Stay alert for a potential bounce or a deeper correction ahead.

CRVUSDT 1D#CRV is currently consolidating inside a symmetrical triangle on the daily chart. 📊
A bounce from the daily MA200 and the Ichimoku cloud looks likely — both acting as strong support zones.
A confirmed breakout above the triangle could trigger a 2x bullish rally. 🚀
Post-breakout targets:
🎯 $0.9036
🎯 $1.0350
🎯 $1.2220
🎯 $1.4602
⚠️ Always use a tight stop-loss to manage risk effectively.

CRV is Getting Ready For a Skyrocket Move (1D)CRV has formed a Cup & Handle pattern — a well-known structure that typically signals a bullish reversal.
From a broader technical perspective, there's additional confluence suggesting a potential trend shift.
If the most recent dip holds, it may confirm that CRV has completed its bearish cycle and has now entered a new five-wave bullish structure. Based on the current price action, it's likely that wave 3 is unfolding at the moment.
Interestingly, the depth of the Cup & Handle formation aligns well with typical wave 5 targets, offering additional validation for this setup.
In this scenario, the wave 3 target sits around $0.78, which also coincides with a previously untapped order block — adding further credibility to the level.
For a longer-term outlook, wave 5 could extend above the $1.00 mark, depending on market conditions and overall momentum.
Moreover, the Ichimoku Cloud is currently reflecting a bullish bias, with price action moving above the cloud and supportive Tenkan-Kijun alignment — reinforcing the overall bullish outlook.
Achieving this target may take time — but as we all know, in crypto, time often behaves differently.
— Thanks for reading.

CRV long "@members
Leverage: 10x
Capital risk: <2.5%
Entry: market
Sl: 0.7252
@members
I like how CRV look, imo one of the best looking charts like VIRTUAL HYPE KAITO. Did a few small trades on it before and it pumped nicely.
Looking for yellow box macro resistance and would go short there.
Some lvls to reclaim take out before that and all depends on tweets and BTC."

Curve Enters Bullish Trend (TAC-S7)Curve started dropping in Jan. 2022. The chart doesn't look great at a first glance but there is some positive news.
The downtrend that started in Jan. 2022 ended in August 2024. This date marked the all-time low. After August, there was a higher low in November (2024) and then again a strong higher low in March 2025. That's the good news. The good news is that the market switched from lower lows to higher lows. So, what was then a downtrend can now turn into an uptrend, the next advance and higher high will make it so.
Long-term weekly time frame CRVUSDT is trading above EMA55 and EMA89. Boom. These levels were first conquered in late 2024 then the drop and recovery above this year signals that the bulls are now in control.
So everything is clear in a way, all that is missing is the next bullish wave. This is what we are expecting and this is what is certain to happen next.
As soon as Curve-Tether moves up, producing a high higher than December 2024, this will confirm the change of trend. The first time an uptrend shows on the chart since 2021.
Namaste.

Curve (CRV) Structure Analysis (1D)BINANCE:CRVUSDT formed a rounded bottom (cup) and a minor rectangle, and it's currently attempting to break above the local $0.83 resistance.
Key Levels to Watch
• $0.64: Current support and minor rectangle lower boundary
• $0.83: Current resistance, cup and rectangle upper boundary
• $1.00: Measured target from the minor rectangle pattern
• $1.30: Measured target from the cup pattern (within a key supply zone)
Other Important Levels
• $0.20: Key demand zone, and 2024 low
• $0.40-$0.50: Key S/R dating back to November 2022, aligned with the cup bottom
• $1.20-$1.30: Main supply zone, dating back to February 2023
A daily close above $0.83 with volume would confirm the breakout and trigger the targets.

#CRVUSDT ( 2 arrows )A red resistance line (first red arrow) and
a red resistance band (second red arrow)
Breaking out of these two red arrows can throw it

CRV USDT Positive cup and handle
After a four-month bearish trend
Upward and positive after a two-day close above 0.83, entry and target 130%
Stop when the daily close is below 0.62

CRV longWent below MO high to ML and bounce strong, MO high reclaimed now looking for sweep of highs


CURVE DAO BREAKOUT - Short EntryLSE:CRV as seen on the 1hr timeframe chart broke downward from the box and has retested the zone. The drop should continue. Trade with caution.
Please support this idea with a LIKE👍 if you find it useful🥳
Happy Trading💰🥳🤗

CRV Head and Shoulders Pattern Formed – Breakout Confirmed🚨 CRV Head and Shoulders Pattern Formed – Breakout Confirmed 📉
CRV has formed a head and shoulders pattern and has already broken out of the neckline. This could signal the start of a potential downtrend, with further downside ahead. 📊
Let’s monitor this downtrend together! 💼💸


CRVUSDT Weekly Analysis – Major Trend Shift Unfolding!!Curve DAO Token (CRV):
Market Structure Overview
Uptrend Phase (2021 – mid-2022):
CRV was in a healthy bullish structure, printing consecutive Higher Highs (HH) and Higher Lows (HL). Momentum was strong and sentiment bullish.
Downtrend Phase (mid-2022 – end of 2024):
Price flipped structure and entered a long correction. We saw a series of Lower Highs (LH) and Lower Lows (LL) confirming the downtrend, following a firm rejection from the resistance zone (~$2.1).
Potential Reversal & New Uptrend (Post Dec 2024):
December 2024 marked a major structural shift. We printed a new Higher High and followed it with a Higher Low — a textbook uptrend confirmation.
Support Zone: $0.22 - $0.33
This area acted as a strong historical base — price respected this zone during accumulation and reversal attempts multiple times over the last 2 years.
Recent price action shows a bounce with volume, confirming demand interest.
Resistance Zone: $1.90 - $2.10
A heavy supply zone where price got rejected in past rallies.
A breakout and weekly close above this zone could signal the start of a strong continuation rally toward higher targets ($3.5+ range).
Break of Downtrend Line
The long-term diagonal resistance trendline has been broken decisively.
Price is consolidating above the trendline with structure favoring bulls — a strong signal of trend reversal.
Bullish Roadmap (if trend sustains)
The current rally could head toward $1.24 (mid-level key resistance).
If price holds and creates a Higher Low (HL), next upside extension could target the $2+ resistance zone.
Sustained break and hold above $2.10 will open room for a macro shift back toward bullish price discovery phases.
The macro chart of CRV is showing a clear transition from a multi-year downtrend into a potential uptrend. Confirmation through structure (HH & HL), breakout of long-term resistance, and a strong support base sets a solid technical foundation.
Keep CRV on your radar.
Patience is key. Let price confirm through weekly closes.
If you find this analysis helpful, please hit the like button to support my content! Share your thoughts in the comments, and feel free to request any specific chart analysis you’d like to see.
Happy Trading!!

CRV SWING LONG TRADE IDEACRVUSDT has done bullish BOS after Turning its trend into bullish (CHoCH). Box is a trap where we can see smaller pump but real swing entry zone is in FVG area, keep eye on that.
