Reversal Pattern will completed?Weekly Chart
BINANCE:CRVUSDT is creating a reversal pattern Head Shoulders on weekly chart.
Wait for a break out Neckline
Daily Chart
CRV's declined Resistance third times
It's going down to Support around 0.77
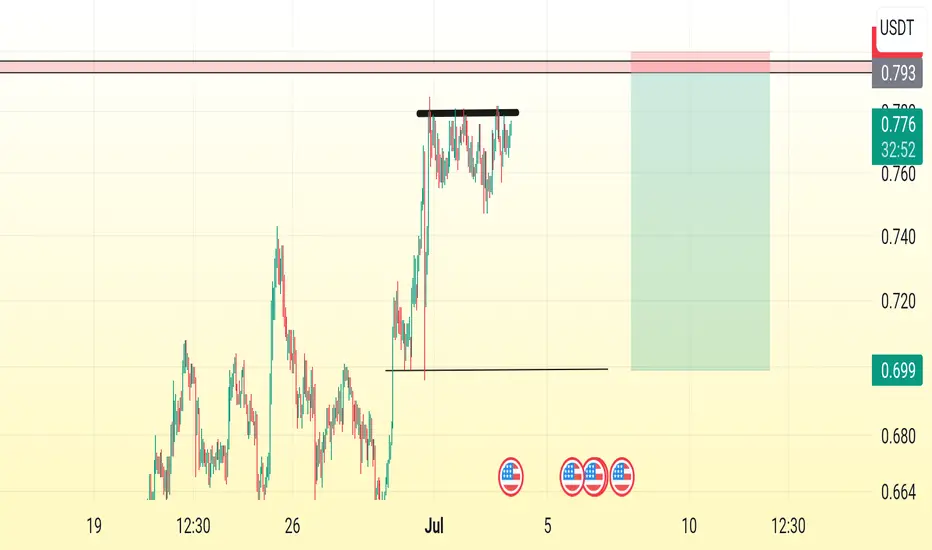
Chart 4H TF
CRS's a support around 0.77
Wait for retest and bounce from Support Zones
CRVUSDT trade ideas


CRVUSDT Multi timeframe analysisTop Down price action analysis on CRV, potential swing shorts lining up monitoring 4H timeframe for valid entry confirmations.

CRVUSDT Potential Consolidation and Upside Breakout in Sight💎Currently, #CRVUSDT has reclaimed its position above the demand area and the 50 Exponential Moving Average, indicating a positive shift in the price action. Furthermore, the price remains above the uptrend trendline, while the downtrend trendline has yet to be tested. This consolidation between the two trendlines suggests a period of potential consolidation until a decisive breakout occurs, either to the downside or the upside.
💎However, based on recent price movements, the probability now favors an upside break, which could lead to a notable surge in #CRV. Chart analysis reveals the presence of three Fibonacci-based resistance levels. It is crucial to closely monitor the second resistance level, which aligns with the 261.8% Fibonacci retracement level. This level holds significance for two reasons: it is a double Fibonacci level, confirmed by the 261.8% and 61.8% Fibs, and it coincides with the psychological round number of $1.00.
💎Naturally, if #CRV experiences a confirmed daily break and closes below the recent lower low, our bullish outlook would be invalidated, potentially inviting more selling pressure. However, as long as the price remains within the established trendlines, the potential for an upside breakout remains.
Stay alert, Paradisers, as we closely monitor #CRVUSDT and await the decisive move that will shape its future trajectory.

CRVUSDT (1H) - Bullish breakoutHi Traders
CRVUSDT (1H Timeframe)
The market is in an uptrend and we are waiting for an entry signal to go LONG above the 0.8170 resistance level. Only the downward break of 0.7890 would cancel the bullish scenario.
Trade details
Entry: 0.8170
Stop loss: 0.7890
Take profit 1: 0.8343
Take profit 2: 0.8623
Score: 8
Strategy: Bullish breakout

CRV/USDT- LONG SETUP CRV is in continuation pattern of making Higher High and Higher Low. If breaks Recent high then there is a petential chance of upward move

crvcrv potential 65% in spot , expect to explode from here , and if it fails , the stop is 4% not more , it looks bullish but there is no time for normal movement , so it necessary to make pump BINANCE:CRVUSDT

CRV give it to me straightIf you find this information inspiring/helpful, please consider a boost and follow! Any questions or comments, please leave a comment! Also, check out the links in my signature to get to know me better!
CRV update,
followed the orange and bounced out of algo zone in, what looks like a 3 wave move down.
The turn at the 1:1 is a concern, tbf.
Staying above .747 is ideal for me atm.
Cheers!
Elliottwave Altcoins Defi

CRVUSDT another pumnp aheadWe expect CRVUSDT to make a move up very soon, potentially even today. The upside target is very close, although the probability is strongly in the favor of an utprend.

CRVUSDT: Breaking the Rising Channel with Bullish Momentum. 💎Recently, #CRVUSDT surpassed the boundaries of its ascending channel, signaling a positive price action. This development has resulted in a change of the mid-term trend from bearish to bullish, increasing the chances of another upward wave.
💎We observe how the previous supply zone has transformed into a demand area, and the current pullback presents a compelling risk/reward opportunity for potential buyers. However, it is important for #CRV to hold its position above this demand area to validate the bullish scenario. Only then, we can anticipate at least one more wave to the upside, with the price targeting a significant resistance area around $0.86.
💎Conversely, if the price breaks below the current support level, it may lead to a continuation of the pullback, potentially reaching the uptrend trendline or the Volume Profile support at $0.67. Regardless, the current probability favors a continuation of the uptrend, and the MCP team is actively preparing to seize potential opportunities.

The idea of a long position on Curve.fiLet's look at this great opportunity to take a long position.
CRV/USDT is looking bullish. There are excellent entry zones - green areas on the chart from which you can take a long position.
I took some from the current values but there is a possibility that we will go a little lower where I will add my position.
I wish you a nice ride on the CRV.
DISCLAIMER! All that is written in this text is not Financial Advice. You, take all the risks associated with trading and investing in the cryptocurrency market - on yourself! Only you and no one else is responsible for your capital and your actions. Only you are responsible for your finances and your actions!

CRVUSDT Short PlanOKX:CRVUSDT.P
At a liquid support & resistance transition level we have bearish Gartley Setup.
Seek for a bearish price action and Boom!
4H 200 EMA can be the TP1 Target.
Good Luck Everyone


CRVKiss down 550MA
short between VPVR tits
0.845 - 0.850
Spanish:
Tiran más dos THETAS que dos carretas

CRV give it to me straight!If you find this information inspiring/helpful, please consider a boost and follow! Any questions or comments, please leave a comment! Also, check out the links in my signature to get to know me better!
Some Elliott Wave counts I am watching.
Cheers!

Key Factors in #CRV's Mid-Term Outlook💎 The mid-term trend for #CRVUSDT is undergoing a shift from bearish to bullish. This transformation is supported by the recent price action, which has witnessed the formation of higher highs and higher lows. Adding to the positive outlook, the Volume Profile level has transitioned from acting as resistance to becoming a support zone, as evidenced by three consecutive bounces over the past week. Moreover, #CRV is currently trading within an ascending channel, with a recent bounce from its lower boundary.
💎 If #CRV manages to hold above the current demand zone, we can anticipate a swift upward movement, targeting $0.81 level. This represents a potential 20% price increase, which is remarkable considering the prevailing market conditions. The $0.81 price level holds significant importance, as it coincides with the top of the ascending channel, a previous demand zone, and the downtrend trendline. This convergence of key features makes it an enticing target for bullish traders.
💎 While the odds currently favor an uptrend, it is essential for Paradisers to remain cautious and prepared for a potential downside breakout. Such a development would likely alter the direction of the mid-term trend. Nevertheless, bullish traders are likely eager to seize such a compelling risk-reward opportunity.
Trade wisely and seize the opportunities that lie ahead, Paradisers! Your ParadiseTeam 🌴


CRV/USDT Position longCRV/USDT
Position long
1st entry 0.75.5
2nd entry 0.735
TP 0.767
TP 0.775
Tp 0.798
T.p 0.815
Sl. 0.697

CRV might pull a hella of leghighest volume on weekly candle and it maintain bullish strucutre for month SL would be close at red target at green


short crv set upsl with your amount to loss. Safe trades. Using divergence confirmation and harmonics, volume decreasing high probable set up

CRVUSDT Elliott Waves AnalysisHello friends.
Please support my work by clicking the LIKE button👍(If you liked). Also i will appreciate for ur activity. Thank you!
Everything on the chart.
Entry: market and lower
Targets: 1 - 1.5 - 1.8
after first target reached move ur stop to breakeven
Stop: (depending of ur risk). ALWAYS follow ur RM .
risk is justified
Good luck everyone!
Follow me on TRADINGView, if you don't want to miss my next analysis or signals.
It's not financial advice.
Dont Forget, always make your own research before to trade my ideas!
Open to any questions and suggestions
