$CRV/USDT 12h (#BinanceFutures) Ascending triangle on supportCurve just pulled back to 50MA and seems to be preparing for another impulse leading to a bullish breakout.
⚡️⚡️ #CRV/USDT ⚡️⚡️
Exchanges: Binance Futures
Signal Type: Regular (Long)
Leverage: Isolated (2.0X)
Amount: 8.1% (Risk=3%)
Current Price:
1.054
Entry Targets:
1) 1.047
Take-Profit Targets:
1) 1.339
Stop Targets:
1) 0.852
Published By: @Zblaba
Risk/Reward= 1:1.5
Expected Profit= +55.8%
Possible Loss= -37.2%
$CRV #CRVUSDT #Curve #DAO #DeFi
CRVUSDT trade ideas

CRV Bullish TriangleThe instrument has formed a local level with two approaches. The purpose is consolidated in the proximity of the level that is also evidence of the Long scenario. The time -free volumes are clearly visible on the schedule. They quickly bought off, which also indicates the predominance of the buyer. The tool is also in the growth of growth .
I expect a planned approach, schedule and impulse access to Long.

crvusdt active stop huntcrvusdt active stop hunt
It can be seen that the hunt for stops is taking place in the strong support range and it is expected that strong buyers will enter the market and lead the price to the rectangular ceiling.

#CRVUSDT 4H Chart
Price is still moving down and it is currently close to testing the 12h demand zone around $0.92. MACD is showing bearish weakness, RSI is sold and EMAs are neutral. I expect price to tap into this demand then move up from there towards the 4h supply around $1.12.

Curve DAO (CRV) formed bullish Gartley move for upto 17.50% pumpHi dear friends, hope you are well, and welcome to the new update on Curve DAO Token ( CRV ) with US Dollar pair.
Our last trade of CRV was as below:
Now on a 2-hr time frame, CRV has formed a bullish Gartley move for another price reversal move.
Note: Above idea is for educational purpose only. It is advised to diversify and strictly follow the stop loss, and don't get stuck with trade

CRV is stuck in a rangeCRV is stuck in a range for 20 days.
we have 2 options.
1- short trades in this range (short on top and long on bottom)
2- or wait for break in each side for long term

CRV LONGI think we are going long on CRV as it rebounced exactly on its trend line and my EMA 13 & 50 and Pivots indicators are showing the same sign.
#DYOR

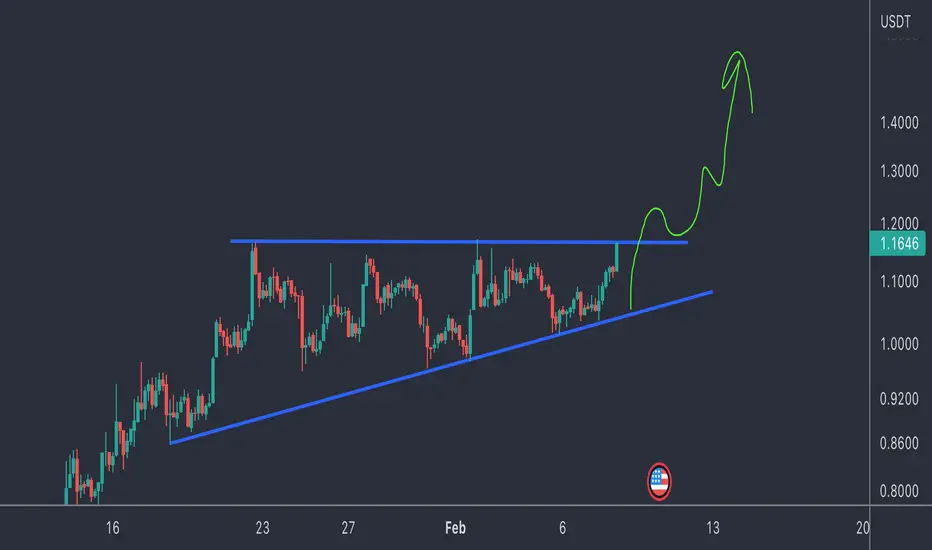
CRV (ascending triangle)CRV / USDT
In STF …price is showing perfect ascending triangle
And currently its testing resistance zone
If breakout done ✔️ bullish move will be followed as my drawing in the chart
CRV/USDT just a little above 200EMAHey traders 👋
Next one on our watchlist is going to be CRV coin here. We see price had a breakout from 200EMA zone but yet still struggles to hold this zone. We are waiting to see what CRV will do near this zone as if we don't see any volume push here soon we might as well go back to lower levels.
If you like ideas provided by our team you can show us your support by liking and commenting.
Yours Sincerely,
Swallow Team 🔱
Disclamer:
We are not financial advisors. The content that we share on this website are for educational purposes and are our own personal opinions.

CRVUSDT future for 5%/50% Absolute X3My recommended trades are based only on the uptrend of the market. It will be opened in the time frame of 1 hour and at the end of the day, profit trading will be closed with any amount of profit. And only losing trades will remain open until they are liquidated. This trading strategy is backtested and works only in an uptrend.

CRVUSDT Daily S/R| Psfp| .618 Fibonacci| Equal Highs Evening Traders,
Today’s analysis – CRVUSDT – trading in a consolidation with a clear set of equal highs that are likely to get taken,
Points to consider,
- Price action impulsive
- Daily S/R Support
- .618 Fibaoncci Support
- Equal Highs Objective
CRVUSDT’s immidie price action is trading in a consolidation that will breaking in the coming days.
A breaking down needs to hold at the current area of confluence, that is with, the Daily S/R, Psfp, and the .618 Fibaoncci, allowing for a bullish bias.
The immediate objective is the Equal Highs, exveeding this level will lead to a larger rise
Overall, in my opinion, CRVUSDT is a valid long with defined risk, price action is to be used upon discretion/ management.
Hope this analysis helps,
Thank you for following my work
And remember!
“You create your own game in your mind based on your beliefs, intents, perception and rules.”
― Mark Douglas

$CRV - stucked in a rangeHello my Fellow TraderZ,
This is beautiful to see $CRV is ranging within a Range. If breaks above, it will blast to $1.42-1.55.
Currently, this is holding 200 Daily EMA which is quite good sign. If this comes down to the bottom of the range which also can be good area to LONG. But stay a bit #SAFU with tight SL if range breaks down.
CHEERS!!!

CRV (Y23.P1.E1) current situationHi Traders\investors,
An quick 8 min video to explain price action and how to approach it.
All the best,
S.SAri

CRV shortSymmetrical triangle on CRV chart is broken down. Bearish movement to support level at 0.78 is expected to happen.

Curve DAO Token CRV price has a chance for another leap upToday we will take a look at the CRVUSDT trading pair.
Our attention was drawn to the fact that during yesterday's market decline, CRV buyers kept the price above the strong mirror level of $0.95-1. As you can see from the trading history of CRVUSDT, this zone has often played the role of critical support and resistance levels.
In general, the growth of the CRVUSD price in January 2023 was x2.
If buyers of Curve DAO token manage to keep the price above the liquidity zone of $0.90-1 in the coming days, there is a good prospect of another +50% growth to the range of $1.35-1.50
An additional fact that Curve Finance has prospects can be evidenced by the Top of protocols with assets placed and blocked in them (TVL) (at the time of writing this idea):
1. Lido Finance ~ $8.0 billion,
2. MakerDAO ~ $7.0 billion,
3. Curve ~ $4.75 billion.
4. AAVE ~ $4.5 billion
5. Convex Finance ~ $4 billion
6. Uniswap ~ $3.8 billion
7. JustLend ~ $3.6 billion
8. PancakeSwap ~ $2.5 billion
_____________________
Did you like our analysis? Leave a comment, like, and follow to get more

CRV : INCREASE TIMINGSeems interesting for a low time frame, as the coins seems to enter into a new increase.


#CRVUSDT Daily Chart
Price had tapped into a major daily supply zone at $1.165 where it got heavily rejected from. MACD is showing bullish weakness, RSI is overbought and EMAs are turning bullish. I expect price to move up from here and trade deeper into the daily supply before expecting bearish movements. Waiting for confirmation.


CRV : INCREASE VIEWThe market seems still stable for day trading, CRV can show coming time an increased view for day trading since it's an important target for confirmation of an uptrend.
we will follow this coin to see if it's able to show some increased view.
At this moment the coin is still stable and going depending on normal market trends,the study shows that the coin are able to increase coming time.
We check always the last possibility and chances on the markets.
CRV seems on this time frame interesting for the watchlist.
The coin has a good possibility to increase over the $1

Possible short for CRVI ll make explanation very brief.
Uptrend is getting weak. Open interest has increased in past 3-4 hrs and we have consolidations while volume does not support the uptrend.
consider money and risk management.
====================
Nothing in this TA is a financial advice.

CRV Investing ideaWe all know iphone is the top one in quality but what If in 2007 it wasnt a famous brand and all the advertising shit thing, then would it still conqueror the world?
No it wouldnt, because money doesnt flow in apple company.
the point is if something works perfect and quality is great doesnt mean it must have value!!
what makes something value? academic answer is :
usable value, rare value, aesthetic value, and emotional value
in crypto market the hype we saw was related to emotional phycology of humans (morons)
who makes that hype? and how?
what is mind and how it works?
what is the matrix?
anyway good luck😉
