Curve CRV - 2000% profit! (lifetime opportunity)
This is a once-in-a-lifetime opportunity to buy CRV at this very low price because this coin can explode anytime soon!
2000% profit is real, no problem at all. You can buy this coin on the spot market or you can open a long position on the futures market.
CRV is currently ranked #78 on coinmarketcap, so there is a lot of room to go up. The market cap is relatively low.
Curve is a decentralized exchange for stablecoins that uses an automated market maker (AMM) to manage liquidity.
This setup is amazing from the Elliott Wave perspective because you can catch the third wave of the third wave, which is a dream setup!
The main trendline is breaking out, and wave 2 has been completed. It looks very promising; do not miss this opportunity.
I don't know what about you, but I am buying this coin! You can buy it with a small amount of your funds, if you want to allocate your capital somewhere else.
All-time high resistance is of course a strong resistance, so I recommend taking profits below this major level to make sure you will get filled.
Look at my ideas about crypto's total market cap, Bitcoin, and LDO in the related section down below.
For more analysis, hit "Like" and "Follow"!
CRVUSDT trade ideas


CRVUSDTCRVUSDT, the charts looks like amazing, if it play as looks like, there's the alot possibility for Upside momentum.
Always do your own research, before entering in any trade.
First of all, there's descending channel formation, looks as bull flag, if breakout attempted here, then the chart target the Adom eye neckline target, and if the Adom eye neckline breakout attempted properly. Then the target would be the 3.30 level, diffinantly will take time, but will achieved the target, if there's everything going well.
👉IMPORTANT : If the red trendline break down side, then don't sleep on the trade for long term. Thanks
The risk reward ratio for this trade is 10.0
GAIN 284%
Loss 27%
Manage your own risk accordingly with that

ALTSEASON - Which ALT is NEXT ?Hi Traders, Investors and Speculators 📈📉
Ev here. Been trading crypto since 2017 and later got into stocks. I have 3 board exams on financial markets and studied economics from a top tier university for a year. Daytime job - Math Teacher. 👩🏫
Here are 3 Altcoins that I'm accumulating for the next bullish cycle, or Altseason 2023. They include :
Litecoin / LTCUSDT / LTCUSD :
Cardano / ADAUSDT / ADAUSD :
CRV / CRVUSDT / CRVUSD :
_______________________
📢Follow us here on TradingView for daily updates and trade ideas on crypto , stocks and commodities 💎Hit like & Follow 👍
We thank you for your support !
CryptoCheck

CRV/USDT looks interesting! Hey, traders
another one that looks interesting to us is CRV coin. We see a nice uptrend forming on this chart but with bigger pressure from sellers which could mean a breakdown from current trend. Well waiting here for $0.890 zone to be broken in order to see a nice downfall here
If you like ideas provided by our team you can show us your support by liking and commenting.
Yours Sincerely,
Swallow Team 🔱
Disclamer:
We are not financial advisors. The content that we share on this website are for educational purposes and are our own personal opinions.

CRVUSDT is testing the key level!The price is testing the dynamic daily resistance inside an ascending channel.
The market got several rejections from this level
How to approach it?
IF AND ONLY IF the price is going to have a breakout and retest it as new support, According to Plancton's strategy , we can set a nice order
–––––
Keep in mind.
🟣 Purple structure -> Monthly structure.
🔴 Red structure -> Weekly structure.
🔵 Blue structure -> Daily structure.
🟡 Yellow structure -> 4h structure.
⚫️ black structure -> <= 1h structure.
–––––
Follow the Shrimp 🦐

crvusdt (wyckoff acc 2+Harmonic deep crab) Wyckoff accumulation schematic 2 found on 4 hour timeframe
also it can comple d leg of DEEP Crab
if resistence breakout successfull then will see quick move to our OB
DYOR NFA


CRV / USDT⏳We try to provide analysis that covers a specific period of time. Make sure you pay attention to the expiration date.
📌Stay faithful to the Stop-Limit at all times.

CRV.Usdt (Y22.P4.Video1). macro and trading levelsHi All,
In this video, we explore a few scenarios and levels + Trend Lines of significance
Everything depends on the caveat that BTC is aligned for a bullish or bearish season.
Your guess is good as mine.
All the best,
S.SAri

CRVUSD " Falling Wedge" analysis 2$ ?CRVUSDT Analysis
CRVUSDT Falling Wedge Analysis 🔥🔥🔥
The above chart of CRVUSDT laid out a Falling Wedge pattern. In a falling wedge pattern, both the upper trend line which connects the highs and the lower trend line which connects the lows converge downwards. The wedge pattern in general indicates a trend reversal. Especially, the falling wedge signals a bullish reversal. This pattern indicates a breakout in the price trend towards an upswing. From the above chart, we can interpret that the momentum of the downtrend is slowing down.
CRVUSDT is currently trading around $0.953. If the pattern broke through the resistance, the price of CRVUSDT might reach the resistance levels of $1.588. If the trend reverses, then the price of CRVUSDT may fall to $0.630
Happy Trading

CRV has begin wave 3CRV has begin wave 3 move with targets of 95% and 170%. Trade is invalid when 2 daily candles closed below $0.905

CRV 4H Review+ Local 4h up trend line
+ MA 50 almost crossing MA 200
+ Higher-highs and Higher-lows
Targets:
Local: 0.9 break out buy
0.950-1.00 the resistance
1.00 accumulate zone break out buy
1.00-1.20 rocket zone
SL:
~0.850 - the last low
- Not sure because of BTC, it can go lower to $19 000 from now. BTC need buyers.

CRVUSDTback above 1$ sooner than you think...
emascurling up
HTF fallingwedge breakout retest
rest of market v bullish rn
this should trickle down to sound fundamental andrecoins also
longterm relevant protocol still relevant imo

CRV analysis in 30 minutes frameGiven the positive divergence I see, there is a good opportunity for a buy position, but with stop loss in mind

CRVUSDT, an EV+ tradeHello everyone, this is a CRV trade that I am considering.
Technical point of view
Nice consolidation in symmetrical triangle, after reclaiming an important support.
BTC will probably break out of its upward consolidation as well and help us push the resistances on CRV .
Confirmation of the trade once we break the main resistance area.
First stops on weak resistance (white lines) to take profits, and/or reopen lower.
Fundamental point of view
CRV is a high potential token that allows via veCRV to get yield in DEFI (up to 30% APY using boosters like stake DAO).
Excellent token to accumulate in bear market on these extremely attractive levels in daily. CRV is the token of the biggest DEFI platform, curve finance.

CRV/USDT looks interestingGood morning everyone,
Next coin that caught our attention CRV coin. Well price it getting squeezed tighter and tighter so some major movement should happen soon but in which direction? hmm
If you like ideas provided by our team you can show us your support by liking and commenting.
Yours Sincerely,
Swallow Team 🔱
Disclamer:
We are not financial advisors. The content that we share on this website are for educational purposes and are our own personal opinions.

buy i keep t n my watch list and n similier to make 3drive and when i see CHOCH in pulback get it mrkahangi

CRVUSDT | INVERSE H&S PATTERNCRVUSDT has been consolidating near an important zone. The inverse head and shoulder pattern on charts projects a bullish trend continuation after a break above the neck line.
This pattern will be only valid till bulls managed to hold above right shoulder. The break below will invalidate the pattern.
The bulls will be only in control above the break of neckline.
While bears will be active below the neckline.
Trade your levels accordingly.

RSI Formula Explained (updated) and a LIVE FAILED tradeThis is just an update to the RSI Formula since some of you are still having trouble with it.
Its not as hard as it seems. Now with the oscillator scale reading ZERO at the mid line, there is no math to do.
RSI Values as follows
0-9 = 1 to 2 rr
10-19 = 1 to 3 rr
21-29 = 1 to 4 rr
30-39 = 1 to 6 rr
Dont worry too much about the last two. you want to be safer at trading with the first two.
The last two are really designed for "Trailing your take Profit"
If you have negative values on your RSI, thats fine. just do the trade in a SHORT and follow the same formula.
Watch the video for the full breakdown

CRV almost done with retracement crv will soon resume downtrend as retracement is about to finish. target 0.750

CRVUSDT, broadening wedge, short term reversalA nice broadening wedge on CRV indicating a short term trend reversal.
A good short entry is located in the red zone under the oblique resistance (dotted line).
Stop loss above.
Bollingers are tight in upper UT, dumping right away is unlikely.

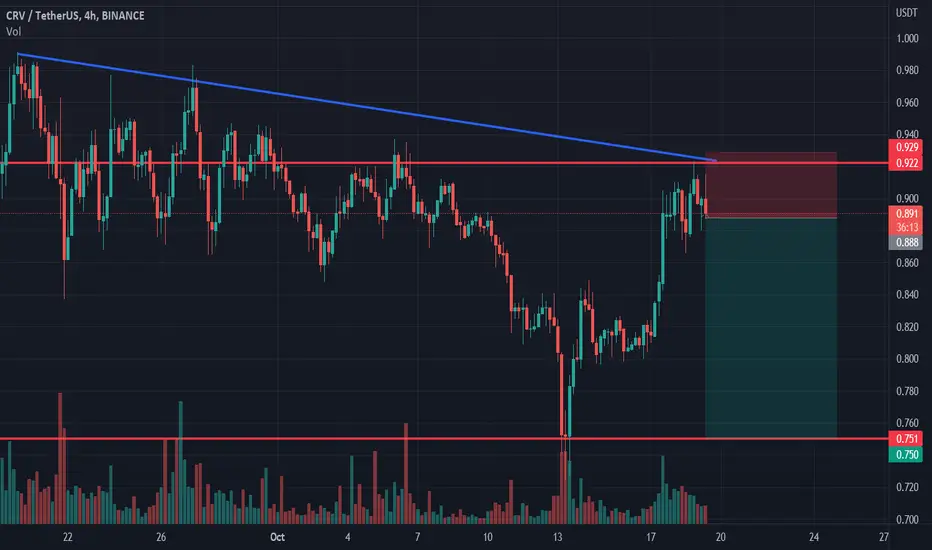
CRV shortCRV bounced off the resistance level. Asset bounced down off the bearish trendline. Decline to support level at 0.75 is expected to happen.