CRVUSDTPERPHello my dear friends
In the lower time frames, we do not have a signal to continue the upward trend, on the other hand, we have the negative divergence of the RSI.
We have reached an important range, there is even a possibility of consuming all the orders in this range. But the probability of entering the $1.62 zone!?!?! I do not think ....
If the current trend falls below the price range of $1.126, the possibility of a decrease to the range of $0.981 and $0.697 is high.
Don't forget, the bullish channel was maintained on the higher time frames.
As a result, the blue zone ($0.697) and the yellow zone ($0.648) are very important for us.
We would be happy to hear your comments
CRVUSDT trade ideas

CRV USDT Upwards soon????It's not financial advice.
Don't Forget, always make your own research before to trade my ideas!
Open to your questions or suggestions.
Buy between - 1.2 $ - 1.15 $
tragets - 1 tg - 1.39 $
2 tg - 1.5 $
3 tg - 2.0 $
stop loss -1 $
@hapiya

CRVUSDTPERPBy shortening the ascending legs and creating a floor lower than the last formed floor, if a lower ceiling is formed and a confirmation candle is issued, it is suitable for a short position.

CRV USDT Upwards soon????just been looking over CRV USDT on the 15 minute tf. We should see some downward movement before a nice 11.4% long opportunity. it could also move straight up so just be mindful of either situation....

CRV/USDT SHORT1. Broken support zone .
2. Entering a position on a retest.
3. Trade in the direction of the trend.


CRVUSDT LONG POSITION Due to the failure of the downward trend and exit from the cloud, it will advance to certain points

CrvusdtDue to the failure of the downward trend and exit from the cloud, it will advance to certain points

CRV/USDT 4HDue to the failure of the downward trend and exit from the cloud, it will advance to certain points


$CRVhopped on to this with .982 below idea invalidated targeting range high for now or the attempt to break downtrend.

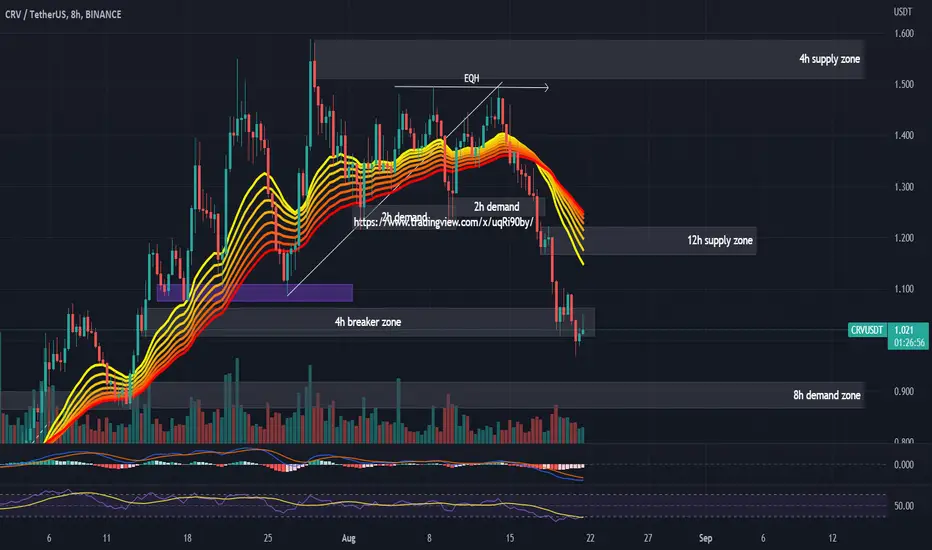
#CRVUSDT 8H Chart
Price dropped after leaving an area of equal highs just below the 4h supply zone where we were looking forward to shorting from but price missed it shortly. MACD is showing bearish weakness, RSI is oversold and EMAs are bearish. I expect price to move up towards the 12h supply at $1.2 before moving down again towards the 8h demand at $0.9. Waiting for confirmation.
CRVInverted head & shoulders pattern in play here, and we are loaded in this coin. (my group) we been buying last 2-3 months.
$4 is only the beginning CRV will do some amazing moves IMO. One of my favorite coins.
And you ain't seen nothing yet IMO.

CRVUSDT wants the pullback?The price is testing the local demand zone on 1.200 - 1.100 area where the price had the bullish impulse.
Now the price is testing the weekly resistance at 1.2$
How approach it?
IF the price is going to flip the weekly and retest as new support, we could see a pullback until 1.3 area, so According to Plancton's strategy , we can set a nice order
–––––
Keep in mind.
🟣 Purple structure -> Monthly structure.
🔴 Red structure -> Weekly structure.
🔵 Blue structure -> Daily structure.
🟡 Yellow structure -> 4h structure.
–––––
Follow the Shrimp 🦐

CRV 28% scalp opportunityMy view on CRV
The chart is very clean for long position if the price push down little lower
Entry : 1.09
Range low
Anchored VWAP from June 18
Daily support
TP : 1.4
Weekly resistance

CRV/USDTCRV/USDT
Well, I think the chart is still bullish.
It is a descending channel that has broken upwards.
He has tested the roof of the channel several times.
I still expect the price to increase.
#GALUSDT #GAL #BTCUSDT #BTC #ETHUSDT #DOGE #DOGEUSDT

CRV triangle breakout 2 📐Curve DAO Token is trying to break this triangle 📐 up and if it will make it I think there is chance for run to 1.755 and even higher. Let's see whether the white local uptrendline is going to boost the price. Setting BUY STOP-LIMIT order to last swing high to catch the breakout.
ENTRY : local high @ 1.474
STOPLOSS (SL) : local low @ 1.335
TARGET (TP) : height of the triangle projected from midpoint of the previous range (PREVIOUS RANGE HIGH - STOPLOSS) @ 1.755
REWARD RISK RATIO (RRR) : 2
INVALIDATION : when SL level hit
See below my previous CRV triangle breakout setup and how the TP2 actually was the top:
Check my other stuff in related ideas.
Please like👍, comment🗣️, follow me✒️, enjoy📺!
⚠️Disclaimer: I'm not financial advisor. This is not a financial advice. Do your own due dilingence.

CRV DAO Technical analysis - Confluence in this area to go long?BINANCE:CRVUSDT BYBIT:CRVUSDT
CRV DAO Technical Analysis
CRV is trading in a symmetrical triangle and the lower trendline is acting as support right now. I map out a few scenarios that could play out with this crypto coin
Not Financial Advice. DYOR. Papertrade before trading with real money.
Safe Trading,
Shawn

CRVUSDT | LONG ABOVE RESISTANCECRVUSDT has been trading in bullish trend. The price is currently trading near the resistance zone. The rising support is continuously hold by price. We are expecting a bullish breakout above the resistance zone. The bulls will be in control above break of resistance zone. While bears will be in partly below the break of rising support.
Trade your levels accordingly.

#CRVI always wanted to have friends that I could help or help me. And now is the time... I would like to help. enjoy
#CRV/USDT

CRVUSDT Analysis (Local Setup)Hello friends.
Please support my work by clicking the LIKE button👍(If you liked). Also i will appreciate for ur activity. Thank you!
Everything on the chart.
Entry: market and lower
Target zone: 1.75 - 1.9
after first target reached move ur stop to breakeven
Stop: ~1.13 (depending of ur risk). ALWAYS follow ur RM .
Risk/Reward: 1 to 2
risk is justified
Good luck everyone!
Follow me on TRADINGView, if you don't want to miss my next analysis or signals.
It's not financial advice.
Dont Forget, always make your own research before to trade my ideas!
Open to any questions and suggestions.

CRV USDT forecast / signalPlease write any advice or suggestions.
Dear friends, request any cryptocurrency pair, currencies pair for forex, and any index that you want to be analyzed and ask any questions.
Thanks for your attention

CRVHELLO GUYS THIS MY IDEA 💡ABOUT CRV Usdt is nice to see strong volume area....
Where is lot of contract accumulated..
I thing that the Seller from this area will be defend this SHORT position..
and when the price come back to this area, strong SELLER will be push down the market again..
DOWNTREND + Support from the past + Strong volume area is my mainly reason for this short trade..
IF you like my work please like share and follow thanks
TURTLE TRADER 🐢
