CRVUSDT Forming Bullish ReversalCRVUSDT is currently exhibiting a strong bullish reversal pattern on the daily chart, signaling the potential beginning of a new uptrend. After a prolonged downtrend, the price action has begun to stabilize and show signs of accumulation, with a noticeable uptick in volume accompanying the recent bullish candles. This confluence of technical factors suggests that buyers are beginning to step in with confidence, possibly positioning for a breakout that could yield significant returns.
The chart structure points to a clear bottoming pattern, which often precedes sustained upside movement. CRVUSDT has shown resilience by holding above key support zones and now appears to be reversing with higher lows and increased buying pressure. With overall market sentiment slowly improving, CRV is well-positioned to capitalize on a broader altcoin recovery. A confirmed breakout from this formation could realistically set the stage for a 50%–60% price increase in the coming weeks.
Volume is a key confirmation here—its steady growth reinforces the bullish thesis and indicates strong participation from investors. As more market participants recognize the reversal structure, CRVUSDT could quickly gain momentum. The coin is also historically known for volatile upside swings, and once trend confirmation occurs, it tends to rally with strength and speed. This makes it a compelling asset for swing traders and medium-term investors looking for asymmetric setups.
With growing interest and a strong technical base forming, CRVUSDT could soon enter a high-momentum phase. Keep an eye on breakout levels and monitor volume for continuation signals as this bullish reversal plays out.
✅ Show your support by hitting the like button and
✅ Leaving a comment below! (What is You opinion about this Coin)
Your feedback and engagement keep me inspired to share more insightful market analysis with you!
CRVUST trade ideas

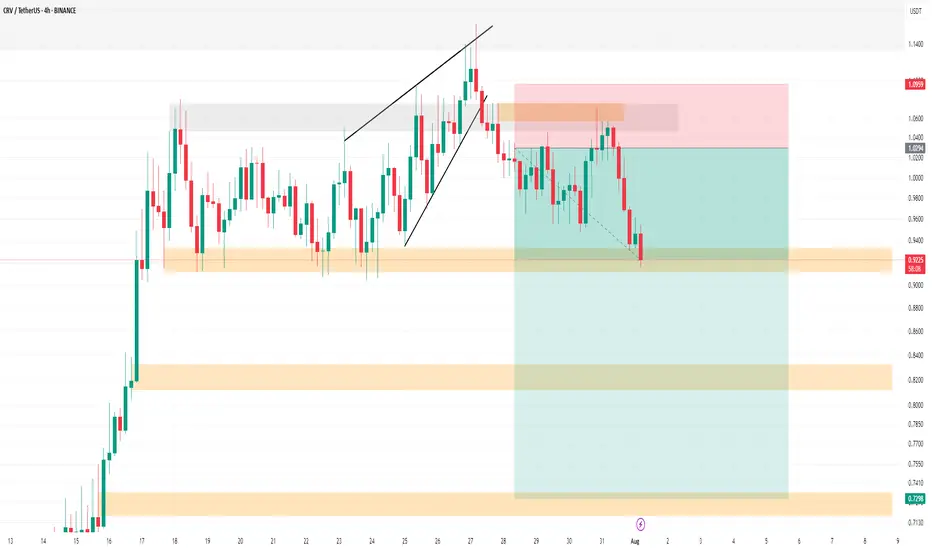
CRVUSDT SHORTI think the CRV has reached the classic target and is in an important area. It could experience a price correction.
TP1: 0.93$ Accessible
TP2: 0.82$ Possible
TP3: 0.73$ Possible

CVR – Ready to Run, Monthly Confirmation In
Tons of strength showing on $CVRUSDT—expecting continuation from here and even more once the trendline breaks.
The monthly candle is confirming the move, pointing to a potential 6-month uptrend. Looks like this one is finally ready for the run we’ve been waiting for.
Buying here and stacking more around 90c if given the chance.
First target: above $2.
BINANCE:ENAUSDT may have gotten away—but this one won’t.
$CRV BREAKOUT LOOKS MASSIVE! LSE:CRV BREAKOUT LOOKS MASSIVE! 🚀
If this breakout holds, it may trigger a bullish continuation.
Entry Zone: CMP
Stop Loss: Below $0.95
Target 1: $1.12
Target 2: $1.22
Target 3: $1.34
Target 4: $1.45
DYOR, NFA
#crvusdt #Altseason2025

CRV SHORT Update Hello.
CRV Update
💁♂️ TP1 🔥
You can see this analysis in the analyses I posted before. It has now reached its first target. Please don't forget to like, share, and boost so that I can analyze it for you with more enthusiasm. Thank you. 💖😍
✅ TP1: 0.93$ Accessible (done)🔥
TP2: 0.82$ Possible
TP3: 0.73$ Possible
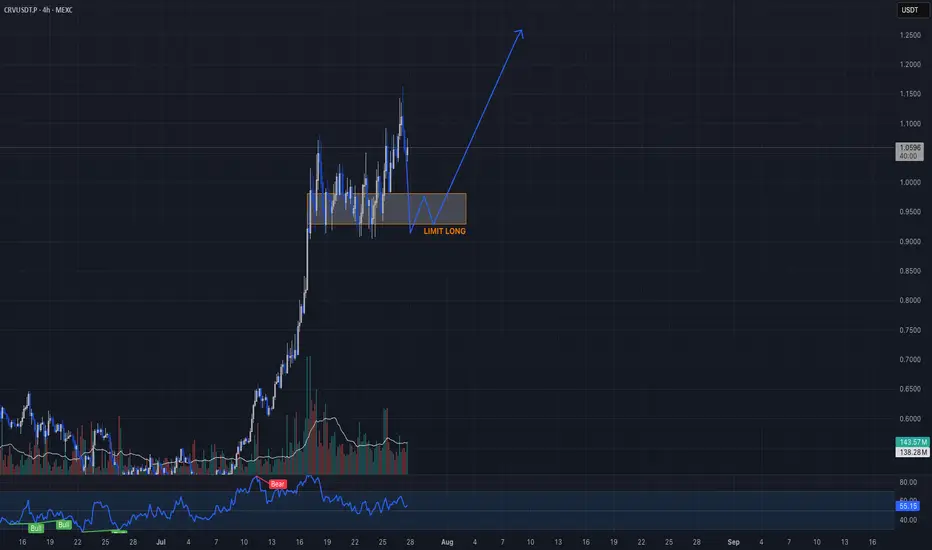
Momentum-backed long setting up on CRVUSDT.PCandle Craft fam — here’s a momentum-backed long setting up on CRVUSDT.P (12H) following a high-conviction trend shift.
Price exploded out of a multi-month base and is now consolidating in a bullish structure. We’re seeing stacked OBs between 0.93–0.98 and volume cooling off after the pump — a classic reaccumulation zone.
Here’s how we’re looking to play it smart:
⸻
🟢 LONG ENTRY PLAN:
Retest Entry (Preferred)
• Entry: 0.9815 – 0.930
• SL: 0.880
• 🎯 Targets:
▫️ TP1: 1.10
▫️ TP2: 1.22
▫️ TP3: 1.35+
Breakout Entry (Aggressive)
• Entry Trigger: Above 1.085
• SL: 0.995
• 🎯 Same targets ☝️
⸻
📊 Why This Setup Matters:
• Broke key structure on volume → now pulling back orderly
• OB stack between 0.93–0.98 = bullish base
• 12H showing HLs, no sign of reversal
• BTC stable = alt rally fuel
⸻
🧩 Candle Craft Note:
We favor precision over hype. This is a textbook continuation play with great RR and structure. Patience pays — don’t chase, let it come to you.
Let’s execute with discipline.
— Candle Craft | Signal. Structure. Execution.
Crvusdt buy opportunityCRVUSDT is forming a potential inverse head and shoulders pattern, with price approaching the neckline zone. The marked entry range offers a strategic buy opportunity for early positioning. A confirmed breakout above the neckline would signal strong bullish continuation, with the final target outlined on the chart. Let us know your thoughts on CRV.

CurveCrv usdt Daily analysis
Time frame hourly
Risk rewards ratio >5.7 👈👌
Target = 1.15$
Short time analysis for traders
LS is very tight. If analysis fields, trader doesn't lose much money but if not ,you will gain the good profit
SEI Trend is FriendAfter 4th rejection, can it go higher ?
if we still keep above 0.5 we can go around 0.63 and testing trendline
Curve is ready to moonobvious Bullish pennant. alt season has arrived
hopefully all of you folks are ready. hope everybody can make life changing money this go round!!

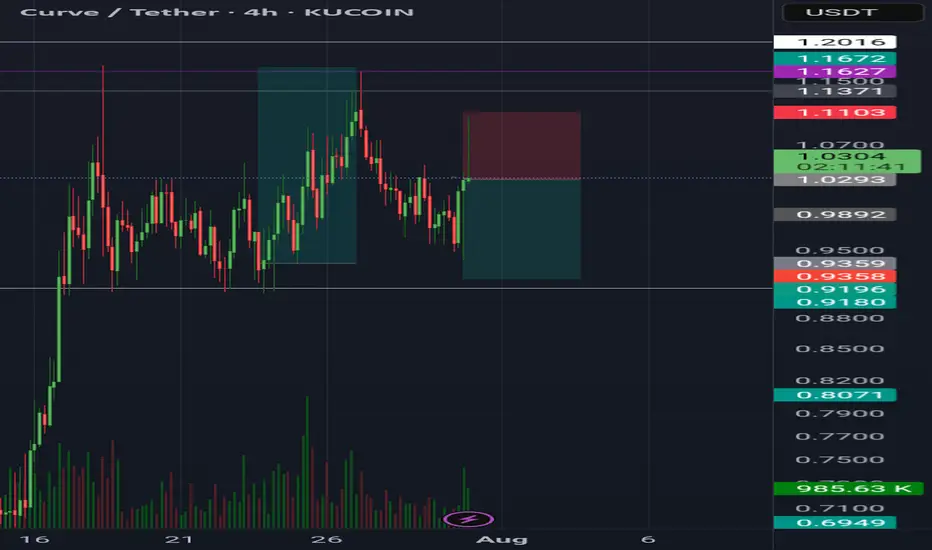
Retail Trap at Resistance📣 Team, get this…
CRV printed 5 green candles, triggered a golden cross, and suddenly every YouTube thumbnail said “TO THE MOON.” 🌝 That’s exactly the kind of retail trap we love to fade. This ain’t DeFi summer, it’s just overheated spaghetti. 🍝
🔥 TRADE SETUP
Bias: Short
Strategy: Retail Trap at Resistance
Entry: $0.98 – $1.03
SL: $1.10
TPs: $0.78, $0.65, $0.50
Why?
– RSI 83 + MACD maxed out = overcooked
– LTF CHoCH after sweeping $1.03
– Positive funding across exchanges → ripe for short squeeze reversal
– Retail buying golden cross = premium exit liquidity
Candle Craft | Signal. Structure. Execution.

CurveCrv usdt daily analysis
Time frame 4 hours
Risk rewards ratio >1.3
Target 0.92$
Short position because of earthquake in the Russia
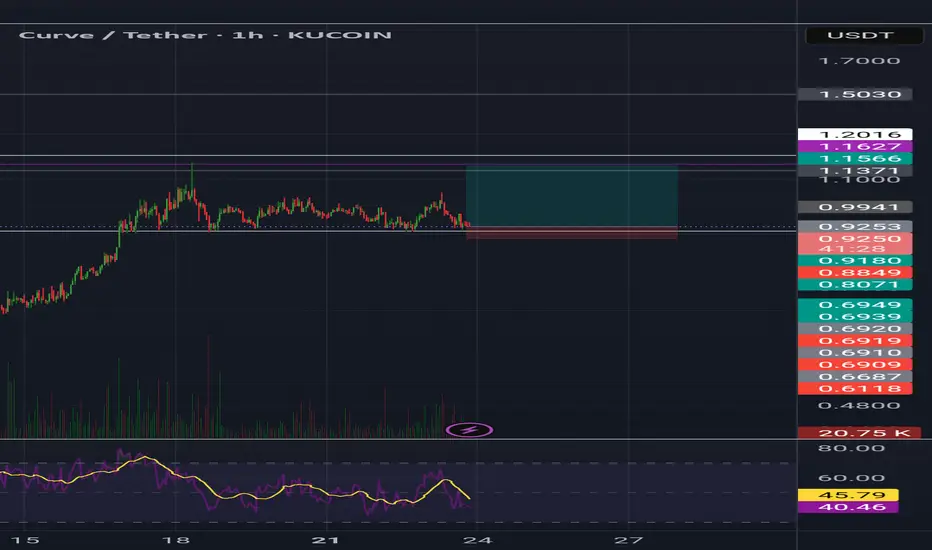
$CRV Equal Lows ShortExtended Range
CRV has been ranging for almost week with no clear direction.
Price has respected resistance above $1.10 multiple times.
Obvious Liquidity Pool
Multiple equal lows are sitting at the $0.90 level, a textbook liquidity magnet.
Market makers are likely to target this area before any substantial move higher.
Short Entry
Short from just above $1.00, stop above the range high.
Target is a sweep of the $0.90 lows.
Next Steps
Watch for signs of absorption or reversal if price wicks below $0.90.
Consider flipping long if strong buyback or deviation forms after the liquidity sweep.
Reasoning
CRV has spent week ranging, building up an obvious set of equal lows. This is classic “liquidity sitting on a platter” for larger players. Short setups are favored while the range top holds, aiming for a stop run below $0.90. After the sweep, be open to a fast reversal or potential swing long if bulls reclaim the level.

CRV Bullish CountCRV Bullish Count
Longer-term Elliott Wave count using trend-based fib time/price projection for CRVUSDT.
Macro bottom identified in August 2024 — entry taken off the bottom range POC retest (pic). Holding for a full 5-wave structure because… why not. Partial profits taken at the potential Wave 1 top.
Wave 1: $0.1801 → $1.33
Wave 2 retrace: to $0.3471 (between 0.786 and 0.886 fib levels)
Wave 3 (current): Targeting between $3.20 and $3.60 (extended Wave 3 scenario).
Fib time 1.618 from Wave 1–2 aligns with Sept 27th — likely Wave 3 top.
Wave 4 retrace: Expected between 0.236–0.382 of Wave 2–3
Wave 5 projection: 1.618–2.618 extension of Wave 0–3 = $5.50–$7.00
Possibly higher with full-blown euphoria.
Fib Time Projection for Wave 5 Completion:
→ Earliest: Late Dec 2025
→ Latest: July 2026
But what is 6–7 months in crypto…
Remember, it's a bullish long term count. It could play out, or fade to nothing depending on market conditions

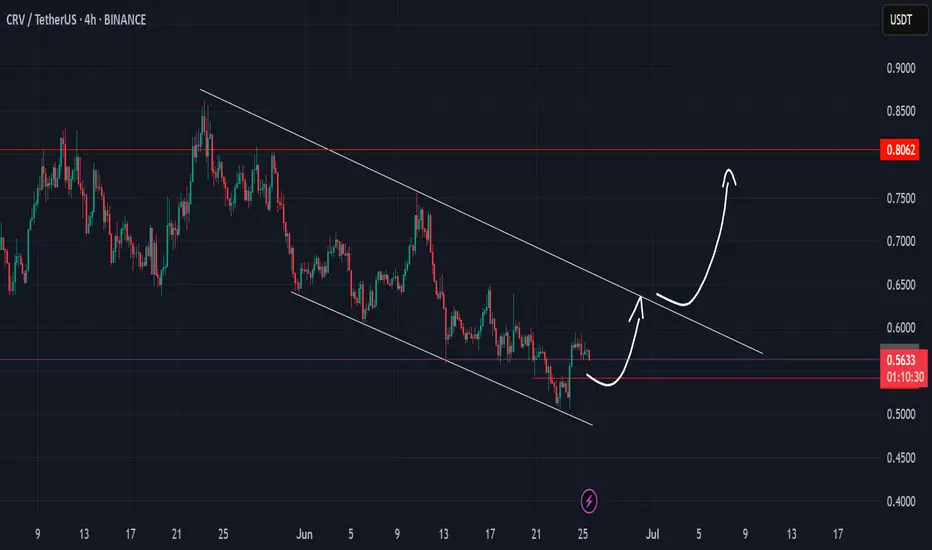
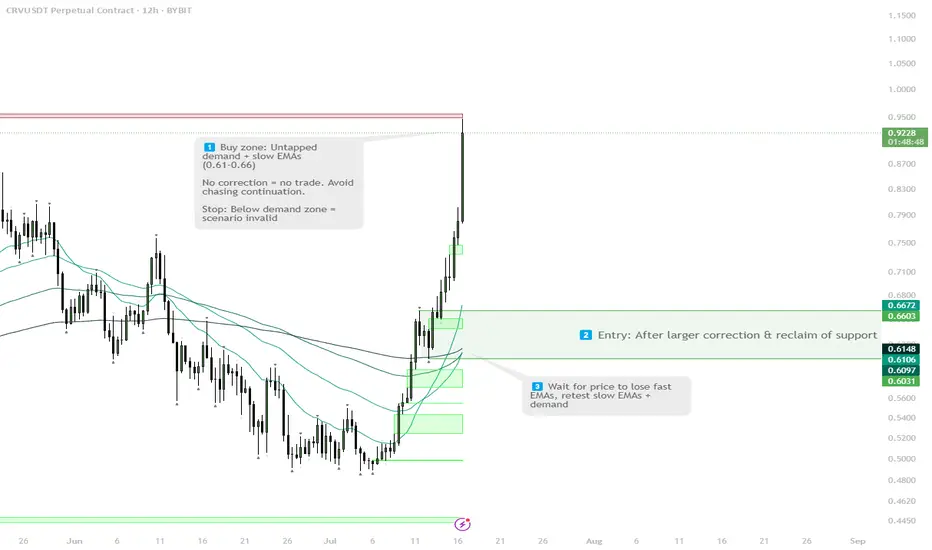
CRV — Wait for Correction to Demand + Slow EMAs1. Wait for correction: lose fast EMAs, test slow EMAs + demand (0.61–0.66)
2. Enter after reclaim/confirmation
Stop below demand zone
No correction = no trade
CRV - Two Scenarios for Strategic Spot BidsBINANCE:CRVUSDT
No FOMO, two clean entries.
Sweep S/R and reclaim EMA 200 — first trigger for spot longs. Equal lows at $0.61 — magnet for liquidity.
Deeper flush to demand = main buy zone ($0.40–0.56).
Stops under main demand.
Plan simple: let the market pick the entry for you.

CRV Approaching Demand — Bottom Fishing in the $0.40–$0.49 Zone🎯 BINANCE:CRVUSDT Trading Plan:
Scenario 1 (Reversal from Demand):
Look for bullish SFP, engulfing, or reclaim in $0.40–$0.49 zone
If confirmed, long with first target $0.83
Tight stop below $0.39
Scenario 2 (Breakdown):
If $0.39 breaks decisively, step aside — risk of new lows
🔔 Triggers & Confirmations:
Enter only with clear bullish trigger on LTF (H1/H4)
No trade if price grinds below $0.40
📝 Order Placement & Management:
🟩 Buy Zone: $0.40–$0.49 (alerts on wicks into zone)
🛡️ Stop: Below $0.39
🎯 Target: $0.83
🚨 Risk Warning:
Only bottom fishing with confirmation — avoid knife catching

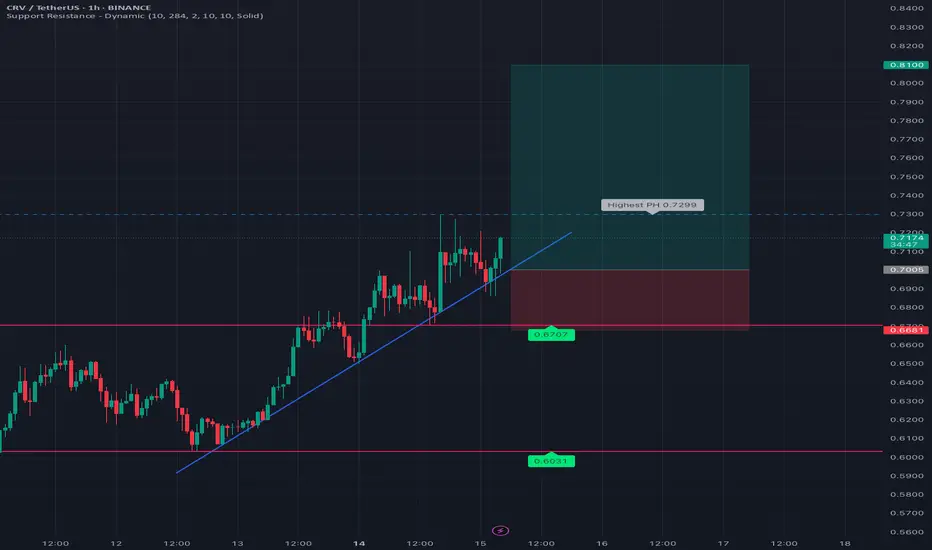
CRV Range Reclaim — Eyes on $0.70 After Classic Deviation Setup🎯 BINANCE:CRVUSDT Trading Plan:
Active Range Setup:
Long Trigger: Deviation and reclaim below $0.5585
Target: $0.70 (mid/upper range)
Stops: Below most recent deviation
Alternative:
If $0.47–$0.50 is swept, look for LTF reversal signals for a new long entry
No Macro Shift:
Stay in range-trading mode until daily/weekly close above $0.76
🔔 Triggers & Confirmations:
Play the range: long on deviations and reclaims, take profit at range high or $0.70
Reassess for higher timeframes only after $0.70–$0.72 or $0.47–$0.50 is hit
🚨 Risk Warning:
Don’t chase mid-range — entries are only at extremes or after deviations

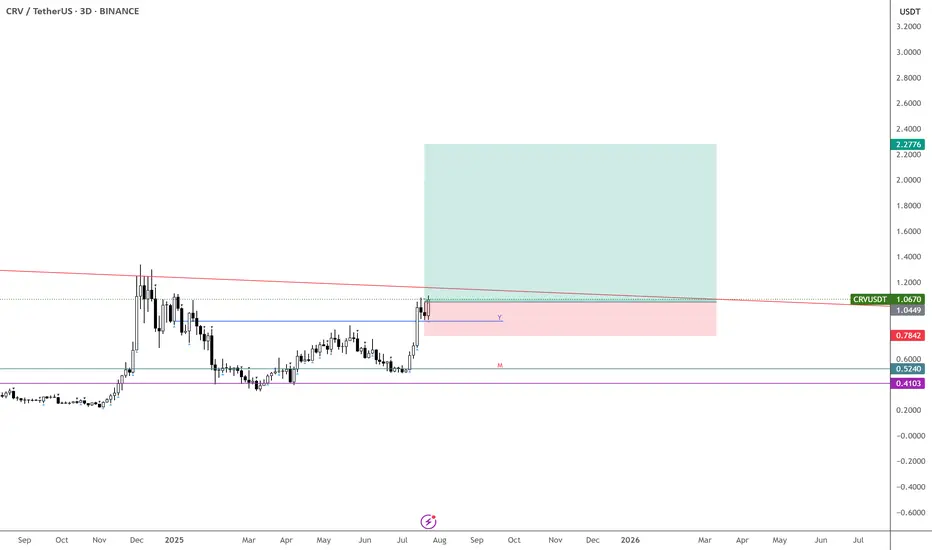
CRVUSDT - Swing Spot Trade RecommendationCRVUSDT - Swing Spot Trade Recommendation
Entry: Current price at $0.55
Targets: $0.83 - $1.40 - $1.80
Strategy: Follow and take profits at W's peak.
Rationale: Monthly trend (M) remains bullish. Weekly timeframe (W) is currently in correction, forming a bottom, with potential reversal confirmation soon.

CRV ANALYSIS🔮 #CRV Analysis 💰💰
🌟🚀 As we can see that #CRV is trading in a symmetrical triangle and given a perfect breakout. But there is an instant resistance. If #CRV breaks the resistance 1 then we will see a good bullish move in few days . 🚀🚀
🔖 Current Price: $0.7280
⏳ Target Price: $1.0800
#CRV #Cryptocurrency #DYOR

CRVUSDT 3D#CRV has broken above the symmetrical triangle on the 3-day timeframe.
If it manages to close the 3-day candle above the pattern, it could trigger a 2x bullish rally. Keep an eye on it — if confirmed, the targets are:
🎯 $0.9036
🎯 $1.0350
🎯 $1.2220
🎯 $1.4602
⚠️ Always use a tight stop-loss and apply proper risk management.

CRVUSDT - Up TrendLook like trend up, can buy it and hold the coin. Hopefully it's touch 3+ percent profit.
$CRV Macro Bearish PlayWe had an inverse cup and handle at .6266 that broke down to .50 and didn't meet its target (.40-.42 area). Instead, we consolidated at .50 to expand the smaller inverse cup neckline to .5503. This move up from .50 to .73 (currently) is a slighty over extended handle. If we continue higher but fail to establish support @ .8231, the next bearish structure is a double top with its peaks finding resistance around .82-.86 and neckline @ .5385. The rest is self-explanatory in the chart.
