CRV Head and Shoulders Pattern Formed – Breakout Confirmed🚨 CRV Head and Shoulders Pattern Formed – Breakout Confirmed 📉
CRV has formed a head and shoulders pattern and has already broken out of the neckline. This could signal the start of a potential downtrend, with further downside ahead. 📊
Let’s monitor this downtrend together! 💼💸
CRVUST trade ideas


CRVUSDT Weekly Analysis – Major Trend Shift Unfolding!!Curve DAO Token (CRV):
Market Structure Overview
Uptrend Phase (2021 – mid-2022):
CRV was in a healthy bullish structure, printing consecutive Higher Highs (HH) and Higher Lows (HL). Momentum was strong and sentiment bullish.
Downtrend Phase (mid-2022 – end of 2024):
Price flipped structure and entered a long correction. We saw a series of Lower Highs (LH) and Lower Lows (LL) confirming the downtrend, following a firm rejection from the resistance zone (~$2.1).
Potential Reversal & New Uptrend (Post Dec 2024):
December 2024 marked a major structural shift. We printed a new Higher High and followed it with a Higher Low — a textbook uptrend confirmation.
Support Zone: $0.22 - $0.33
This area acted as a strong historical base — price respected this zone during accumulation and reversal attempts multiple times over the last 2 years.
Recent price action shows a bounce with volume, confirming demand interest.
Resistance Zone: $1.90 - $2.10
A heavy supply zone where price got rejected in past rallies.
A breakout and weekly close above this zone could signal the start of a strong continuation rally toward higher targets ($3.5+ range).
Break of Downtrend Line
The long-term diagonal resistance trendline has been broken decisively.
Price is consolidating above the trendline with structure favoring bulls — a strong signal of trend reversal.
Bullish Roadmap (if trend sustains)
The current rally could head toward $1.24 (mid-level key resistance).
If price holds and creates a Higher Low (HL), next upside extension could target the $2+ resistance zone.
Sustained break and hold above $2.10 will open room for a macro shift back toward bullish price discovery phases.
The macro chart of CRV is showing a clear transition from a multi-year downtrend into a potential uptrend. Confirmation through structure (HH & HL), breakout of long-term resistance, and a strong support base sets a solid technical foundation.
Keep CRV on your radar.
Patience is key. Let price confirm through weekly closes.
If you find this analysis helpful, please hit the like button to support my content! Share your thoughts in the comments, and feel free to request any specific chart analysis you’d like to see.
Happy Trading!!

CRV SWING LONG TRADE IDEACRVUSDT has done bullish BOS after Turning its trend into bullish (CHoCH). Box is a trap where we can see smaller pump but real swing entry zone is in FVG area, keep eye on that.

CRV 1H Chart SetupThis chart features CRV on a 1-hour timeframe with a 50-period SMA, RSI(14), and trend lines. Created for technical analysis and personal reference. Shared for transferring to another account.

Is #CRV Ready for a Reversal or Not? Key Levels to Watch Yello Paradisers! Are we about to witness another brutal trap as #CRV finishes its final leg up and prepares to flush all late longs? Let’s break down the setup for #CurveDAOToken:
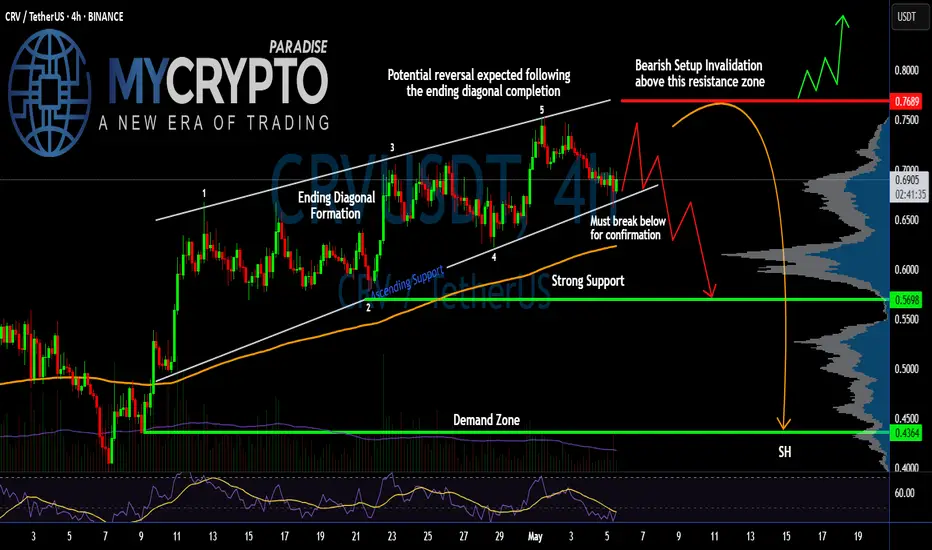
💎#CRVUSDT is currently trading around $0.6948, and what we’re seeing here is a classic Ending Diagonal Formation, a pattern well-known for luring in unsuspecting bulls before reversing violently. The structure has completed its five-wave sequence, and the price is now teetering just above key support.
💎The resistance zone near $0.7689 is where the whole game flips. This level has been clearly rejected before, and it now marks the invalidation point for any bearish outlook. A sustained move above this region with solid momentum would invalidate the diagonal and potentially send the price toward the $0.80+ mark. However, without that breakout, the bearish reversal remains the dominant scenario.
💎#CRVUSD is holding above rising trendline support, but this support is critical. A break below it confirms the end of the diagonal and should trigger a strong sell-off. The first target on a breakdown is the $0.5698 area, a zone previously respected and backed by significant volume profile interest.
💎If sellers gain traction and that level breaks down too, we’re watching for a move toward the demand zone at $0.4364, which aligns with the lower volume shelf—this is where the real pain could begin for over-leveraged traders caught on the wrong side.
Play it safe, respect the structure, and let the market come to you!
MyCryptoParadise
iFeel the success🌴
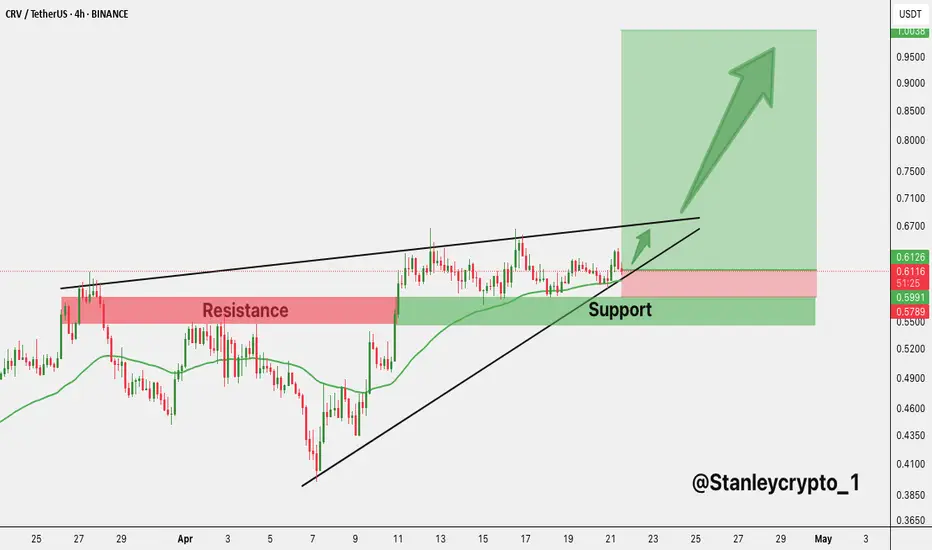
CRV Breakout Retest – Eyes on the Next Leg UpLSE:CRV has been trading within a well-defined ascending channel, showing a consistent bullish structure. Recently, the price broke above a key horizontal resistance level and is now retesting it—this is a classic breakout-retest scenario.
As long as CRV holds this support and remains within the channel, the bias stays bullish. A successful bounce from this zone could lead to a strong continuation toward the upper boundary of the channel or higher.
DYOR, NFA

Curve (CRV)Crv usdt Daily analysis
Time frame 4hours
Risk rewards ratio >2.5 👈👌
Target = 0.8$
Moving up and down in the uptrend tunnel

CRV/USDT – 2W Chart Overview
The price is currently consolidating after a prolonged downtrend and shows signs of a potential trend reversal.
The price has broken out of a falling wedge (bullish pattern).
Currently testing the Fibonacci retracement levels — most notably the 0.5 - 0.618 zone, which may act as a pullback entry zone.
📌 Key Buy Zone: Retest of the breakout near the 0.618 Fibonacci level (~0.55 - 0.60) could offer a strategic entry if confirmed by price action.
🎯 Upside Targets:
1st Target: 1.0966 USDT
2nd Target: 1.3328 USDT
3rd Target: 1.6212 USDT
Invalidation: Break below the support zone near 0.45 would invalidate this setup.

CRV/USDT LONGCRV/USDT has successfully broken out of a falling wedge, signaling a potential bullish trend. To confirm the breakout before entering a trade, an ideal long entry would be a retest of the breakout level around $0.45 - $0.48. Alternatively, if the price maintains above $0.50, a breakout continuation entry remains valid.
For profit targets, the first level of resistance stands at $0.58, marking a key psychological level. The next major resistance is at $0.70, offering a potential 40% upside, while an extended target at $0.80+ could be reached if bullish momentum persists.
Risk management is essential, with a conservative stop loss placed below $0.45, invalidating the wedge breakout, and a more aggressive stop loss set below $0.42, which aligns with a major support zone.
With an entry at $0.48, a stop loss at $0.44 (-8%), and a take-profit target at $0.70 (+45%), the trade presents a strong risk-to-reward ratio (RRR) of ~5.6:1.
To manage the trade effectively, the stop loss should be moved to break-even once the price reaches $0.58. If the price approaches $0.65 - $0.70, securing partial profits while allowing the remaining position to run is a strategic approach.
What are your thoughts?

CRV is an underrated chartLSE:CRV is an underrated chart — currently in no man's land, with a weekly interest zone marked for potential trades.
Up 100% off the lows… wow.


CRVUSDT 1D Chart Analysis | Bullish Momentum Signals & Moving AvCRVUSDT 1D Chart Analysis | Bullish Momentum Signals & Moving Average Crossover
🔍 Let’s break down the CRV/USDT daily chart and highlight the key technical factors setting up for a potential bullish move.
⏳ Daily Overview
The chart shows CRV breaking out of its previous downtrend and moving within a well-defined ascending channel. Notably, the 25-day moving average (yellow) has just crossed above the 99-day moving average (purple), a classic bullish crossover that often precedes strong upward trends.
📈 Technical Highlights
The 25 MA crossing above the 99 MA is a textbook bullish signal, suggesting that trend momentum is shifting in favor of buyers.
RSI is currently near the overbought zone (around 70), indicating strong buying pressure. When RSI approaches these levels, it often leads to sharp candles and increased volatility, as momentum traders step in.
Price has reclaimed the $0.6922 resistance and is targeting the $0.7545–$0.7924 zone, which aligns with the upper boundary of the channel.
Volume is increasing during bullish moves, confirming that buyers are active and supporting the rally.
🔺 Bullish Triggers
If CRV holds above $0.6922 and maintains momentum, a rally toward the $0.7545–$0.7924 resistance zone is likely. A clean breakout above this area could open the door for a move toward $1.00, especially if volume continues to rise and momentum stays strong.
📊 Key Levels to Watch
Support: $0.6678 / $0.6377
Resistance: $0.7545 / $0.7924
Bullish confirmation: Daily close above $0.7924
🚨 Conclusion
CRVUSDT is showing strong bullish signals with the moving average crossover and rising momentum. RSI near the overbought zone suggests that sharp candles and further upside are possible, but also be prepared for volatility and quick moves. Watch for bullish triggers above resistance and monitor volume for confirmation.
#CRV #CryptoAnalysis #TradingView #Altcoins #ACA

CRV breaks out of range — retesting key support for continuationPrice action on CRV has officially broken out of a 12-day range and is now retesting the range high, which has flipped into support. This level holds significant weight due to its alignment with the VWAP SR zone, making it a strong area of interest for potential continuation.
VWAP SR and previous range high acting as support
Above-average volume confirming breakout momentum
This current retest is critical — holding this region keeps the breakout structure intact and opens the door for a 20% rotation toward the daily SR resistance above. If buyers continue stepping in here, momentum should carry the move forward. However, failure to hold this support could mean a deviation and a return to equilibrium, so risk management remains key.

#CRV/USDT#CRV
The price is moving within a descending channel on the 1-hour frame, adhering well to it, and is heading for a strong breakout and retest.
We are experiencing a rebound from the lower boundary of the descending channel, which is support at 0.6600.
We are experiencing a downtrend on the RSI indicator, which is about to break and retest, supporting the upward trend.
We are looking for stability above the 100 moving average.
Entry price: 0.6614
First target: 0.6840
Second target: 0.7120
Third target: 0.7420

CRV/USDT : BUY...Hello friends
Due to the good price growth, you can now buy in the specified areas in stages and with capital management and move to the specified goals.
*Trade safely with us*

$CRV breakout alert!📈 LSE:CRV breakout alert!
Price just broke above a key ascending triangle resistance on the 4h chart — strong bullish momentum in play.
Entry:-CMP
Target: $1.06
Stop-loss: $0.577
R/R looking juicy! If volume holds, this could be the start of a powerful move.
Watch it closely....... DYRO, NFA

#CRV/USDT 30% Rally imminent. Bull Flag Breakout Incoming!$CRV/USDT: Missed out on MAGIC? This could be your next opportunity.
ENTRY :- .5778 TO .6100
SL: 0.5626
TARGETS :
.6433
.6782
.7144
.7644
.7881
.8010
Dyor nfs.
I’m sharing some of my high-conviction trades with you all.
I also plan to build a team of traders to participate in trading tournaments.
DM me if you’ve been trading consistently and want to join.
It's free, there are no fees.
See you!

$CRV Breakout loadingLSE:CRV is coiling up inside a rising wedge! ⚡️
Currently sitting above the key support zone with a clean structure. A breakout above resistance could trigger a sharp move to the upside — eyes on that $0.95+ target! 📈
Breakout loading… 👀
DYOR | NFA
$CRV is gearing up for a breakout! LSE:CRV is gearing up for a breakout! 🚀
Price is ranging tightly & eyeing a breakout. A clean close above resistance could spark a 37% rally.
Entry: 0.6050, 0.5870, 0.5700
Targets: 0.6500, 0.7000, 0.7450, 0.8000, 0.8500
SL: 0.5450
Don’t miss this setup.
DYOR, NFA.
#Altseason2025

Bullish Triangle Pattern on ProgressIn my previous update on BINANCE:CRVUSDT , I mentioned three potential scenarios: a bullish triangle formation, sideways movement, and a double top pattern.
Right now, it looks like the bullish triangle pattern is playing out. If this continues, I expect the price to reach the 0.7853 – 0.8343 target zone. But before that, all eyes are on the key resistance at 0.6667 — the prior high.
The best-case scenario would be a strong breakout above 0.6667, ideally with a solid bullish candle showing strong buyer momentum.
However, stay cautious. If price breaks the resistance but quickly falls back into the triangle and breaks the low of the breakout candle, that could be a false breakout (or what some might call a liquidation sweep). In that case, reducing exposure could be a wise move, as price might enter a sideways phase.
On the other hand, if price gets rejected (before breakout) at 0.6667 with a large red candle, that’s still acceptable — as long as price holds above the invalidation level at 0.5781.
Let’s keep watching how price reacts around key levels. Market structure still favors the bulls, but risk management is key.

CRV +70% & Rising!
LSE:CRV broke out of a bullish wedge and bounced perfectly from the $0.45 support zone
Next targets:
🎯 $0.8991
🎯 $1.3283
Structure still favors upside 🚀

CRV Eyes Higher Low as Key Confluence Zone HoldsThe Analysis covers CRV
Curve DAO Token (CRV) may be in the early stages of reversing its downtrend. Price action on the daily chart is now consolidating above a highly significant support zone filled with technical signals that often attract buyers and mark turning points.
- CRV is holding above a cluster of key levels—the value area low, 0.618 Fibonacci retracement, and a nearby swing low—indicating that bulls are defending this area.
- A reclaim and steady hold above the key swing low would signal the formation of a higher low, which typically precedes upward continuation.
- A volume increase paired with VWAP holding near this zone would strengthen the bullish case and suggest a potential breakout.
CRV's price is forming what looks like a textbook higher low—an early indicator of a potential shift toward a bullish trend. The current range aligns several critical support indicators: the 0.618 Fib retracement, the value area low, and a local swing low, all layered near a weekly S/R flip. This overlap strengthens the probability of a solid base forming.
The slow, steady price movement just above this zone often hints at accumulation. A quick dip below the swing low and sharp recovery (liquidity grab) could be the final signal before a breakout. If the value area high begins acting as support, it would show growing buyer confidence and a willingness to buy pullbacks.
Should bulls hold the current zone and drive price above the value area high with increasing volume, CRV may be ready to break higher. With accumulation underway, any push above local highs could kick off a stronger trend move. For now, the market is watching to see if the higher low holds firm.
