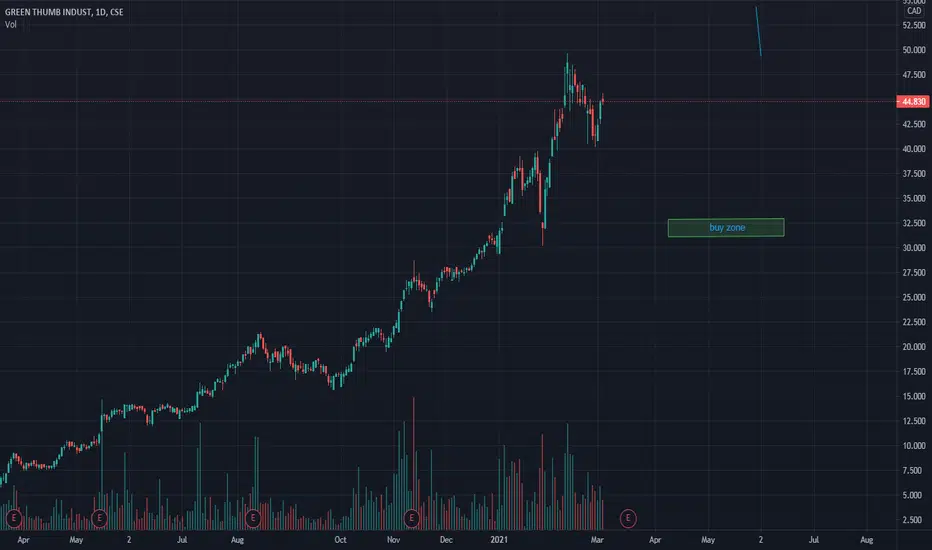
Wycoff & WeedBehold the darling of the MSOs, GTBIF looks to be building a textbook Wycoff bottom... I believe we are early-to mid phase B. Ignore the timeframes and pay more attention to direction, levels, and volume.
"Phase B: In Wyckoffian analysis, Phase B serves the function of “building a cause” for a new uptrend (see Wyckoff Law #2 – “Cause and Effect”). In Phase B, institutions and large professional interests are accumulating relatively low-priced inventory in anticipation of the next markup. The process of institutional accumulation may take a long time (sometimes a year or more) and involves purchasing shares at lower prices and checking advances in price with short sales. There are usually multiple STs during Phase B, as well as upthrust-type actions at the upper end of the TR. Overall, the large interests are net buyers of shares as the TR evolves, with the goal of acquiring as much of the remaining floating supply as possible. Institutional buying and selling imparts the characteristic up-and-down price action of the trading range.
Early on in Phase B, the price swings tend to be wide and accompanied by high volume. As the professionals absorb the supply, however, the volume on downswings within the TR tends to diminish. When it appears that supply is likely to have been exhausted, the stock is ready for Phase C."
What we're looking for here is the bolded... for smaller price spreads and volume on the downturn. A lower low (if it happens) will likely accompany the bottom falling out from under the economy, in which case it's a buying opp (along w/ everything else).
For now trade the range.
This ain't financial advice, just a reminder to use common sense.
GTII trade ideas

Green Thumb, Cannabis Growth stock at good entry price multi year 25% earnings grower trading at 25 pe here.
double over sold with rsi and bollinger bands showing low readings.
peg ratio of 1.
tangible book value at 3.02.
buying calls and stock, will take profits on the calls to pay for the stock.
ride the stock for free for years.

Ascending Triangle breakout for GTII GTII appears to be one of the cannabis companies in America holding their market cap relatively intact.
There is an ascending triangle pattern on the verge of breaking out, and like clockwork cannabis reform in America is a hot topic to capture voters of all ages.
“There’s no excuse for our not being in the forefront for something that is now legal for 97 percent of the American public and, where people have a chance to vote, they vote to change the policies,” Blumenauer said. “I am hopeful that we can see some action following through on the legislation I passed—but, more importantly, on the things that the American people want.”

Green Thumb: Over the hurdle 🚧The price of Green Thumb continued to work on establishing itself above the resistance at C$16.15 last week. Although it briefly fell back to the mark, it quickly reacted and turned upwards again. We expect the magenta-colored wave (iii), which the share is currently working on, to extend a good deal further upwards. This should be followed by a countermovement, which, however, is likely to be replaced by renewed gains at a considerable distance from the mark, which should lead to the high of turquoise wave 1.

4 soon, 20 later? Green Thumb Industries Green Thumb is in most of the cannabis etfs and top of the list. Its one of the only cannabis stocks that is profitable now and has growth potential at a reasonable value.
If down trend continues for 2023, I am interesting in seeing how low it goes and then reviewing its future prospects.
2025, numbers according to anaylsts, are really when Green Thumb will start to shine and accelerate. For 2023, hopefully it gets discounted to juice to potential reward.

GTBIF - Green Thumb Industries | Pot Stocks Cycle Correction With the recent pump and dump on the Safe Banking rally, it has become visible that most of the pot stocks sector is in a corrective state, setting up for a cycle correction. GTBIF appears to be in a triangle and will look to correct this triangle in the coming weeks/months.
For the most part, I would be alerting myself in the "loading zone" with a potential timeline of mid-late summer.

Overlaying stock valuation levels vs picture trading #gtbifI used stare at charts and colored bars and tried to find shapes to figure out the next move. Guess what, I missed out on a lot of easy opportunities to hold and ran scared out of good stocks because I didnt understand growth valuation.
Stocks will do things that dont make sense on the charts. Stocks are businesses.
We really need to understand the companies behind the charts. Its just lazy and a missed opportunity not to do so.
In this this video, I create some valuation assumptions and overlay them on the charts for insights.
Bear case valuations and bull case valuations.
Hope you enjoy it. Cheers.

DAILY SECTOR WATCH🟢WEED STOCKS TOP 10
Teradyne
Curaleaf Holdings
Green Thumb Industries
Trulieve Cannabis Corp
Canopy Growth Corp
Verano Holdings Corp
Cronos Group Inc
Tilray Brands Inc
Cresco Labs Inc
SNDL Inc
🔴CRYPTO COINS TOP 10
Bitcoin
Ethereum
Binance Coin
XRP
Dogecoin
ADA
Matic
Tron
Dot
Solana
🟣INDEXES
US30
S&P 500
FRA40
GER30
NTH25
ASX200
EUSTX50
JPN225
HK50
Banknifty
🔵SPACE STOCKS TOP 10
Iridium Communications Inc
Ses
Rocket Lab USA Inc
Aerojet Rocketdyne Holdings Inc
Viasat
Maxar Technologies
Eutelsat Communications
Astra Space Inc
Sats
Planet Labs
🟤RETAIL FOOD STOCKS TOP 10
Kroger Company
Albertsons Company
Sendras Distribiduira S A
Sprouts Farmers Market
Grocery Outlet Holdings
Weis Market Inc
Ingles Markets Inc
Arko Corp
Companhia Brasileira De Distribuidao American
Beyond Meat

lame duck session impulse wave?The gray overlay is an exact day for day clone of the period from oct '18 to feb '21, the last bearish cycle.
Notice the correlation of local inflection points, right down to the week where short term trends shift. If this pattern stays true then we could be seeing a local low early-mid january followed by a strong impulsive wave 5 into the $25+ area into summer.
This tracks with the expectation of most that some type of legislation (SAFE Banking) will pass during the lame duck session. BTMFD.

Green Thum Industries CanadaSun Storm Investment Trading Desk & NexGen Wealth Management Service Present's: SSITD & NexGen Portfolio of the Week Series
Focus: Worldwide
By Sun Storm Investment Research & NexGen Wealth Management Service
A Profit & Solutions Strategy & Research
Trading | Investment | Stocks | ETF | Mutual Funds | Crypto | Bonds | Options | Dividend | Futures |
USA | Canada | UK | Germany | France | Italy | Rest of Europe | Mexico | India
Disclaimer: Sun Storm Investment and NexGen are not registered financial advisors, so please do your own research before trading & investing anything. This is information is for only research purposes not for actual trading & investing decision.
#debadipb #profitsolutions

Descending Broadening Wedge for GTII?Price target CAD $4.20 by June 2023.
GTII is trading well below the 200DMA, expect a bounce towards the downward sloping resistance of the descending broadening wedge near term and short or sell your swing trade in that area.

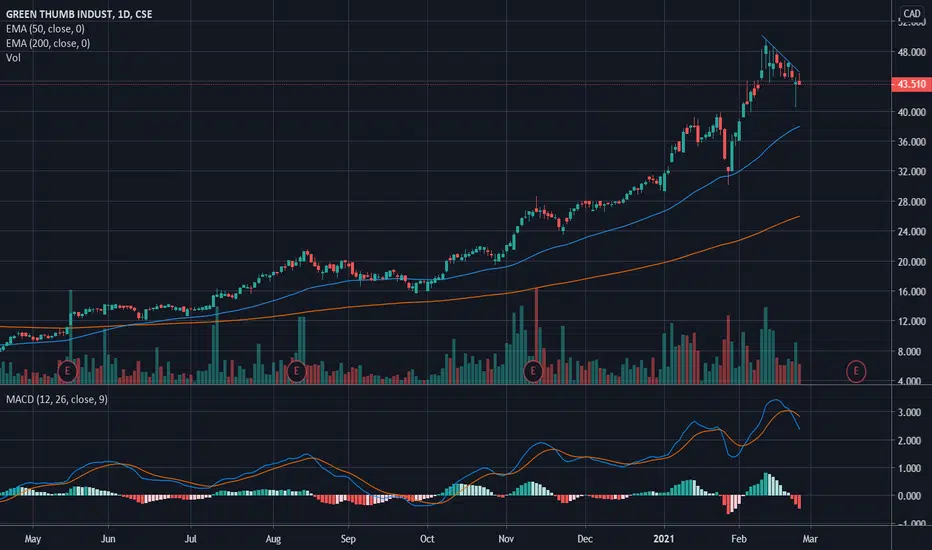
Green Thumb Industries Inc - $GTBIF Chart Analysis (Continued)TAKE A HIT OR LET IT SIT?
Like most of the cannabis sector, the last couple days of the first week of May oversold than I expected, while hitting all my price targets, it happened faster than expected.
Last Chart Analysis (March 26th, 2022):
This will change my overall look and move the primary cycle 4th and 5th wave (as presented in new chart)
The MACD quickly corrected what was a peak of divergence and now shows a hard sell continuation.
I would expect to see a 3-4 correction here, any price around $10.60 = $10.32 with a chance of going north towards $13.52 for possible PT via correction peak.
Expect hard selling early Nov (if not a little before then) and to continue to sell until April of next year ('23), making $6.02 - $5.60 a possible floor. I would assume chaos if it goes under $5.60

Green Thumb Industries Inc - $GTBIF Chart AnalysisTAKE A HIT OR LET IT SIT?
On the weekly chart, $GTBIF has flexing big highs and 'Debbie Downer' lows, can the 420 spark enough buzz to get investors back high?
Correction ('ABC' / '12345' Interval Completes) - Now 4th-5th wave, expect divergence via MACD throughout until cycle completes.
With the POC around $9 (history), expect the Middle of May selling to continue into the summer. $13.50 looks like a good mid point, collecting itself before last selling with a final landing zone around $11.60 to a possible $10.50 to finally catch the volume before correction.

Green Thumb // Watch for the trigger !Here is a quick review of the $GTII price action.
Keep an eye for the trigger that can be pushed by a daily RSI bullish divergence between wave 4 & 5 and earnings (if they beat the estimate).
If validated the trigger can push the price to previous ATH with significant selling pressure in the "High resistance" zone.
In this scenario, the trigger would be a good DCA point for long term holding.
If invalidated, further downside can be seen and the "HIGH SUPPORT" zone is to watch for a perfect entry.
I'm learning here so feel free to give me your toughts and advice !
Thanks !

$GTBIF - is it our time? This bounced right off of support. It has many positive indicators using the strat method on the daily and weekly (called continuation).
It also has a positive sign of divergency + the news re the safe act helps this baby move.
It is in a death cross so above the 50 MA on the daily I will consider adding commons.

GTBIF Green Thumb Industries Mighty triangleLets see if the price can stay in this triangle and hopefully break bull in fall. GTBIF is the best MSOS stock for me. It is much stronger as the etf MSOS. Reloading? Stop below triangle.
If GTBIF cant stay in MSOS have big problem as a whole...

Breakout opportunityLooks like it's ready to breakout if it clears $32. July 7, 2021 there was a 12 month price projection of $70 and the average PT this year is $51.70.

GTII is trading in a GIANT Descending Triangle.It's always possible this pattern plays out bullishly as a bull flag, a directional shift in momentum will likely occur leading up to earnings or a sell-off afterward.
On September 1st GTII will report their next earnings, and the ending of this pattern is September 24th, Descending Triangles and Bullish Flags more often than not make a decisive move in one direction or the other, whether it's a fake-out or not, 50%-75% through the pattern formation.

ONE LOVE! Let's get together on weed stocks. Oh boy! Where were you when all this was happening?
Cannabis (aka weed) stocks as a group set to take off. This could be bigger in percentage terms than Biotech pumps we saw in the pandemic period.
As some will be aware major changes have been happening in the USA and Canada to 'legalise' certain aspects of cannabis. GTBIF and CURLF were ahead of the race. Changes are following in many other countries.
Both GTBIF and CURLF may correct significantly so if investing here one has to look for a nice pull back and take a controlled loss.
But this post is not just about two cannabis stocks. There are dozens of these stocks in Canadian and US markets and Google will help you to find them. The could be more long term investment opportunities, say over 5 to 10 years. Buying low should be easy for many of these stocks. Some on my watchlist are:
TSX:CRON,
TSXV:EMH,
TSXV:N,
NASDAQ:TLRY
I'm not saying the above are great. If others find good ones, then help out everybody else by sharing.
Other cannabis stocks are at all time lows. Some say they will pick up. How would I know?
Disclaimers : This is not advice or encouragement to trade securities on live accounts. Chart positions shown are not suggestions and not intended to assure you of an advantage. No predictions and no guarantees are supplied or implied. The author trades mostly trend following set ups which has a low win rate of approximately 40%. Heavy losses can be expected if trading live accounts. Any previous advantageous performance shown in other scenarios, is not indicative of future performance. If you make decisions based on opinion expressed here or on my profile and you lose your money, kindly sue yourself.

Still bullish ganja, US Legalization becoming imminent, IMOI'm not counting weed out, I think this is a lot less speculative than most market participants think. If we do have a lot of downside to come, I can see the big 4 MSO'S holding up relatively well. One to stick on the watchlist for sure.

Want to add this, see what happens tomorrowStill very bullish weed, this is one name I really want to add. No exposure yet, only weed position is CXXIF.
GTBIF - Bullish Descending Triangle PT USD 40As seen above, GTBIF forms a descending triangle with decreasing volume, slowly turning MACD and RSI falling in oversold territority.
Entry: As soon as EMA breaks VWAP and confirms upward trend. Buy zone around ~USD 36
Exit: Around ~USD 40.
This is no financial advice.
