#SNDL - Rounding bottom and huge H&S in Weekly TFAfter sharing my vision of SNDL in the short term, through an analysis of H1 chart, I would like to share my long term vision, using a weekly chart.
After IPO in Aug 2019 (13$) there's been a lot of diluition of shares which brought the prices down to 0.2$. During this huge drop, the prices reacted on Jan 2020, reaching 3.9$ and creating the left shoulder. After that prices dropped again reaching the bottom and they reacted again in Feb 2021, re-testing again the neckline that was created one year before.
In my opinion the price is now forming the right shoulder before attacking again the neckline for the third time, completing the H&S formation. This might take 1-2 years the latest - in my opinion - and once prices are there we could see a strong brekut of the neckline pushing the prices up to the 0.382 Fibo level and 0.5 Fibo Level a 6.69$.
Moreover, from the chart is pretty visible how the price is forming a reversal bottom which gives us a strong indication that buyers want to take this out from this stagnant price levels.
So this title will not payback immediately and we need to patient.
SNDL trade ideas

SUNDIAL GROWERSBased on the cheap price level of this thing, I'm expecting huge upside on this to break both those tops. it might take a very long time to take off but if you buy now it would yield very great returns, unless this company simply just fails. my suggestion, BUY IT NOW !!!

SNDL - PT $1.30Parabolic steps detected on 5min charts and is advancing to step 3. Once step 3 is established SNDL will move into the final stage where we have a PT of $1.30. Any sell off below previous step will invalidate this pattern. GL!


SNDL's last drop ? About 2 month ago the stock went all the way up out of a small zone. It was heavily shorted then.
The strong zone was opening at around 0.8 USD. This is the strongest tradet point (volume) on the chart.
I think it will settle today and go up tomorrow, because now it was a Shorting-of-the-Thrust because it went under 0,8 USD and returned upwards.
Next week the earnings of Q1 will be out. SNDL is dept free.
The target price is above 5. It will settle there to test the top and maybe turn back or turn up.

Bullish Gartley pattenIt has created bullish gartley pattern. I'm not sure if it's gonna work or no!.

Strong Buy on Sundial SNDLThe fibonacci retracement looks accurate, and the support levels are playing out well. I just love the way this stock has been moving, I've been on it's wavelength since January. Let's see if it we can keep this chemistry going.


I can see the trend and bullishness for SNDL. Bounce play.i am basing this on it previous DNA and TREND line; it will be long wait for as BULLS to fight this shorts/bear; MAY- JUNE you will see a sideways trends; or even dipping a bit. but come june - july; you can expect our baby to soar!!! i can be wrong, i am not completely saying this will be "IT" but bottom line, YES HOLD; ADD more if you want. we will see its gonna close to 1$ and never gonna drop again.

SNDL Harmonics- Long CallThis is update to previous SNDL "Bottom IN" call (see linked chart below). This updated chart is to provide a bit more of my insight to what I feel is going on. Today SNDL may make a bit of a rest and bring itself back down to 0.86 cents to form a more stable bottom to the pattern. We are currently at .382 and those are not so common for deep crab patterns.. so I am expecting it to come back down a bit. This may serve a better opportunity for late traders to get in before a move up. This will be your last opportunity as well lol... So look for a buy in maybe around 0.86 cents.
Again this may also spike up today- if so- be ready. However its not common to see a .382 fib force a pump up, but it does happen in super strong bull markets. I do not think we are in a bull market right now. However, you can see here the OVERALL thinking and long term move in mind.. which should payoff well. ENJOY!
If you like the chart- please THUMBS UP and SHARE. Thank you

Devils threeway lettuce UpdatePitchfork trendlines Blah Blah Blah.
I dont normally give dates, but i'm pheelin a little prophetic.
May 3rd is the day to watch to see which trend line... or pitchfork... SNDL follows.
does it follow the longer timeframe pitchfork or the shorter timeframe pitchfork ?
my hopes are up, but my loins are down.

Latest analysis for SNDLIf you saw my latest post I talked about short term down trend being broken (now marked on faded blue line) those lines were made last time with a daily candle. This time I worked with the 1 week candles which made me see what I was expecting from SndL (I’m using the Heikin candles to remove noise and get a more accurate long term trend) knowing be broke daily down trend and seeing that we are close to the end of this beautiful triangle makes me believe SNDL is not going to the moon today or tomorrow. But slowly we are going the right direction. Green line shows the long term uptrend and asides from Hype!!! We have a company that i believe has lots of potential to grow.


$SNDL Sundial Growers Option Traders Bullish
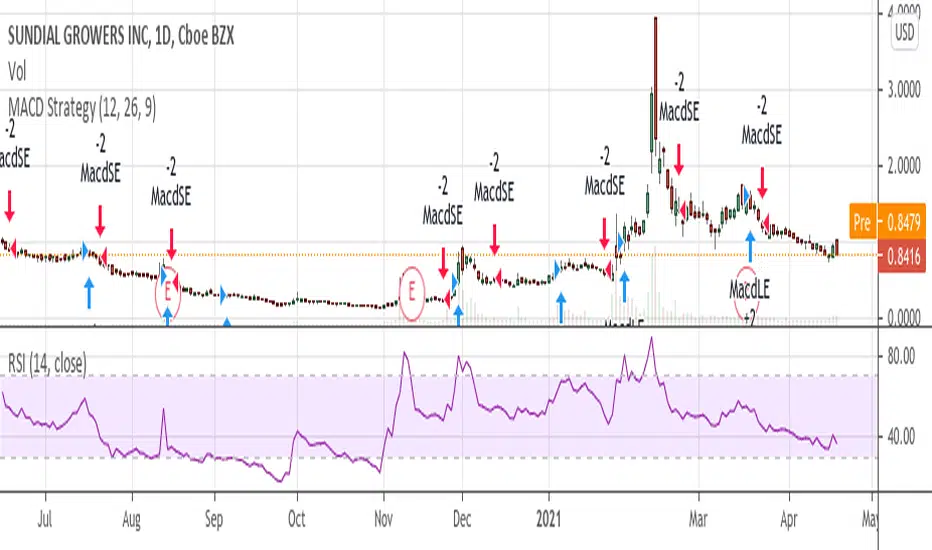
options activity in the stock is looking quiet bullish as the stock seems to showing signs of reversal.
- major Bullish Divergence on the Histogram/MACD
- Volume shelf support has held on several occasions
- Potential target trade target to teh 100ma and 0.236 Fib retracement level.
- Always a candidate for short squeeze or legalizations news flow pumps.

SNDL Bottom in?We seem to be seeing the appearances of many bottoms in the market (GOOD SIGN for other profitable trades). SNDL is another one. This one may take off hard to the upside with little prep. I have entered already just before posting this chart. The price action has already tested the 50% Fib and gone sideways.. and so now its just a matter of time. If it does not pop today should trade sideways for awhile. Set your stops and lets see what SNDL can deliver to us. Should be a quick easy payoff on this one. I did call an earlier premature bottom, but maybe this is it.. if not- set your stop and you live another day. These bearish patterns can be very trickey.. an exploited hard to the up or downside, but when called properly they pay well. We say this on RKT not long ago- and NKLA.. RKT was big. NKLA has yet to play completely pout but same pattern. SPCE is another one that is about to complete t THE SAME PATTERN lol. Just ones to watch. I AM. One thing is you do not want to be on the wrong side of these patterns.


Stoners Pitchfork Battle Which pitchfork for SNDL will win?
We have a good Downtrend Pitchfork and a good uptrend pitch fork Based on different pivot points.
Which one will win?
I'm just testing Pitchforks. Buying all these pitchforks. I'm opening an emporium soon.

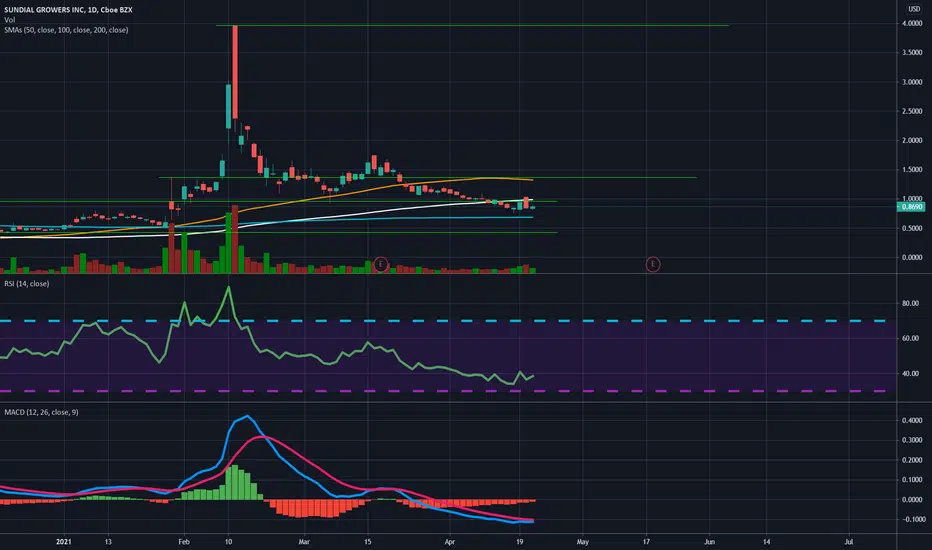
SNDL breakdown. Looking at SNDL and we are definitely suffering with this one. Option play on this one is down like most of my positions, but i am not panicking. Im still bullish on the cannabis sector and i believe this year will be a good year for cannabis stocks. The 1 dollar price is important for this stock to move up, and if we can reach 1 dollar we can see a move up to previous highs. Market conditions will play a role and the MACD is in the red right now and the RSI is starting to head up.
I'm not sure the 5th wave is starting or the 3rd wave!cypher targets:
AB=0.38 XA
BC=1.42 AB
tp1=1.27 BC=$2.3 *reached
tp2=0.78 XA=$4 *reached*
tp3=2 BC=$11
other possible targets:
tp4=0.88 XA=1.6 BC=$5.5
tp5=2.24 BC=$20
tp6=1.6 XA=2.6 BC=$47
I wouldn't sell till see a reversal harmonic pattern.

SNDL Looking To Get VERY LONG if And Only If It Tests 52 Wk LowTitle says it all - Weed banking approval on the way. Do your own DD - NOT ADVICE On SNDL
SNDL Critical support at 0.618 level (~ $0.84)According to my observation of SNDL stock, it has a strong support at 0.618 fib level. In case this support level holds for some time, the stock can go to the moon again.
