SNDL trade ideas

SNDL - How to gain followers in one easy step.Hello fellow traders; time for another analysis w/ SmoothPips
🙏 If you enjoy the analysis please make sure to leave a like and follow; so we can catch these pips together!
❓ What's unique about SmoothFX?
-All trades executed off of the same "strategy"
-Easy to read charts
-Multi Time Frame Analysis
-Learn and Earn experience
-Very high probability
-Experienced
🎯Leave some feedback & let's chat. Always willing to hear other bias'.
📌Remember; markets are moved through liquidity. We will earn more by helping each other.
🤞Please remember not every analysis will be 100% correct. Use your own due dill & discover your own research.
Sincerely,
SmoothPips
<3

Dancing on the trendline Risk/rewardThe setp up its market and sector dependent, as its all along the same neighbourhood. We need upward confirmation on any major player in the sector, cgc, tlry or cron(for mega corfimation). However this is fanteastic risk reward entry at the bottom if you are game
It is a great trade because the risk reward factor its perfect
We enter the trade at the bottom with a stop right there below 1.07, if it drops we re enter at the next support, early 90s..
Trailstop tight all the way up, but once you are out of the pennant and cross the trendline resistance, you can relax the stop to the higher dolar moves as the volatility will increase as itapproacehs and leaves each resistance.
Recoommended trade size////1000 shares just a thought
good luck!

Sndl- bottom is in!With the growth of cannabis markets it would be foolish to miss this opportunity; however I would only risk capital I am willing to lose. This way psychologically you are less likely to back out a trade. ..
With decriminalization in sights, i believe i would go as far as buying this stock for the long-term and short-term.
That being said i think my charts can speak for itself i put in several upper and lower trendlines the price action could potentially follow, if it does not follow the trendline its ok. I will reassess and not get discouraged.
never fear
Happy trades!!

SNDL: The most important Key Points we must keep in mind!Hello traders and investors! Let’s talk about SNDL again! Since our last study, it hit our target at $ 1.25 and it lost this price level, which now seems to be working as a resistance. If you missed our last analysis, the link to it is below this post.
Ok, SNDL didn’t react around the $ 1.25, and it retested it as a resistance, following the Principle of Polarity , and we have lower highs/lows in the 1h chart. What’s more, it seems we have a purple trendline guiding the past top levels, while the 21 ema works as a resistance zone as well. Probably the trendline and the 21 ema are the most important key points for both, short and mid-term.
All of this is a clear statement that the trend is still bearish , and we have yet to see a clear reversal pattern. Now, let’s see the daily chart:
The idea of an Inverted Head & Shoulders pattern still exists, but it gets weaker as the time passes and SNDL doesn’t trigger it. It did a Piercing Line pattern (as evidenced by the blue square), but if the price loses it’s low, then the $ 0.95 is the next target for it.
We must see a good reversal pattern in the 1h chart before we see it reversing in the daily chart as well, but it seems SNDL is in a very delicate situation and whatever if it is bullish or bearish, we’ll have our answer very soon.
Remember to follow me to keep in touch with my daily studies, and if this idea helped, please, support it with your like!
Thank you very much!

$SNDL PT 24 and higher Sundial Growers Inc. engages in production and marketing of cannabis products for the adult-use market in Canada. It produces and distributes inhalable products, such as flower, pre-rolls, and vapes. The company offers its products under the Top Leaf, Sundial Cannabis, Palmetto, and Grasslands brands. Sundial Growers Inc. was incorporated in 2006 and is headquartered in Calgary, Canada.


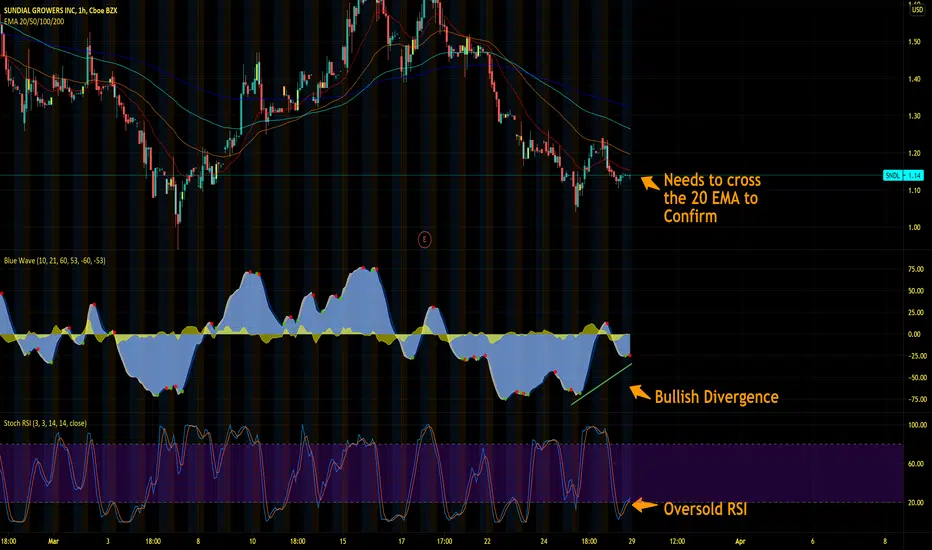
SNDL looking to get high againSNDL is setting at a decent buy zone right now.
RSI is Oversold
BlueWave has a Bullish Divergence
I would wait for it to break the 20 EMA range to have an even better confirmation to the upside.
SNDL Long Term IdeaHey everyone just a friendly reminder , I'm not a professional trader I just share my ideas in base of my opinion and experience using theories and indicators. Trade at your own risk and never buy or sell before doing your own DD.
Here in SNDL we can see in the long term run an easy way up to $7 - $8 Range. Every time the stock have a huge spike it have a drop and then it have another huge spike creating new high highs and new high lows. We can see as well candles trading above the SMA line and the EMA line is above of the SMA Line as well and that is a very good sign in this 1 Day chart for the long term. Good Luck to everyone.

Sundial Growers SNDL- Looking at a triple bottom? or is it over?Sundial Growers SNDL- Looking at a triple bottom? Don't call it a comeback!
SNDL-Repeating PatternsOn this analysis, we can clearly see the repeating patterns that SNDL been forming on its chart.
-It is pretty clear how SNDL is in love with the Ascending Triangles.
-While some triangles took days till the breakout (rise), some took months (purple triangle). So it really depends on market sentiment and investor's confidence.
-The recent big rise again followed by a nice drop which brought the potential for another Ascending Triangle formation.
-Another fact about the patterns is that every rise was followed by a bigger rise! But also every drop was bigger (in percentage) than the previous drop.
For ex: While the first 2 drops were 24% and 40% big, the next 2 ascendings had a drop of 60% and 50%. And lastly, the recent drop was 70%. So each time,
the returns are bigger, but the risks are getting bigger too!
-Currently, the length of the triangle is 1 month and 14 days. The longest time it took to break the triangle (purple triangle) was 2 months. Looks like we are going
for the 2 months long triangle formation again!
-With the given lost confidence among investors due to the market volatility and rising bonds, it is more probable that SNDL will wait for couple more weeks to fill the 2 months period for another breakout and rise.
-ATR is also getting close to its Volatility support level, but still has some space to drop. Probably will cause a little more drop in SNDL price as well.

SNDL looking goodJust a beginner looking for insight. Looks like SNDL is set to go on a long climb up?

Possible breakout situation for Sundial!This fledgling cannabis stonk has a great future ahead of it in my eyes. Just peep their instagram! They're definitely seemingly in-the-know. I'm thinking of this position as a long hold. But also will probably reach a short term peak soon.
Have fun!
Not investment advice

$SNDL Rare Emerging Weekly SmileyFace of ProfitLine emerging on the monthly chart somewhere at $6. That looks like a good target for bull cycle. Just had decent earnings come out today compared to last year, some shorts are getting squeezed too. GO APES GO!


Bearish Reversal for SUNDIAL (SNDL)We broke down from the descending triangle - bearish reversal initiated.
Need to retest $1.4 and then confirm as support again for me to be bullish.
We are now below the 50d MA on the 4H time frame - be cautious.

SNDL - Meme or TA Dream?
I know SNDL is still living in Reddit/Meme territory, but there are also some very solid technical analysis (TA) indicators that could mean we're in for another push.
Chart above has call outs for major points of consideration, but will recap here as well:
Each push that SNDL has made, comes back to the .618 retracement line (which is a pretty sizable pull back).
The most recent push has already made that pull back.
We have touched the 50 day moving average and the long term support line .
Each time in the past the 50 day moving average and support line have been touch there's a big push that follows
The only caution I see here is the overbought position on the Stochastic RSI (1 day candles). We could see a drop in the next day or two, but I don't see that impacting the over all trend. It could be another test/tap on the support line before a big push.
Lots to consider here, but it feels like we have some pretty strong bullish signs for SNDL in the coming weeks.

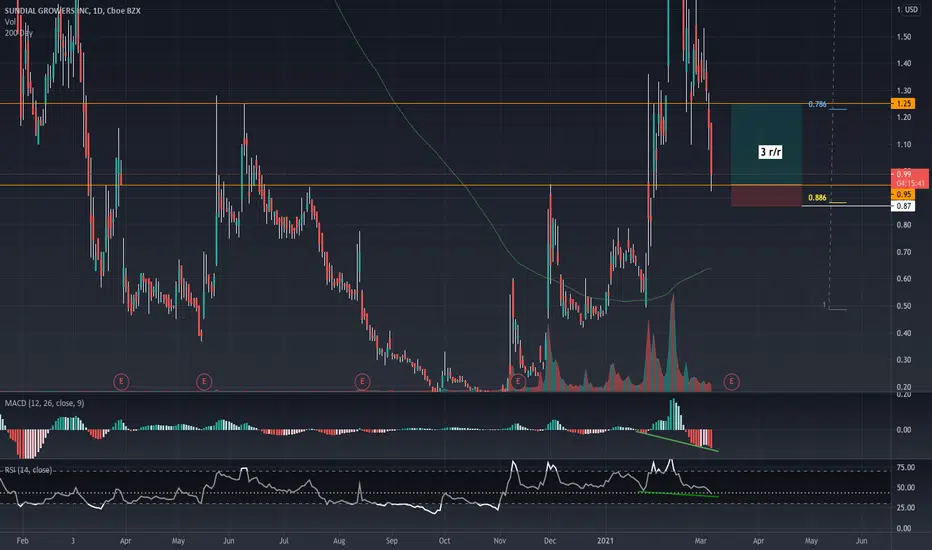
SNDLSHORT-TERM: At major support and .886 retrace, also potential hidden bullois divergence eventually (not financial advice)
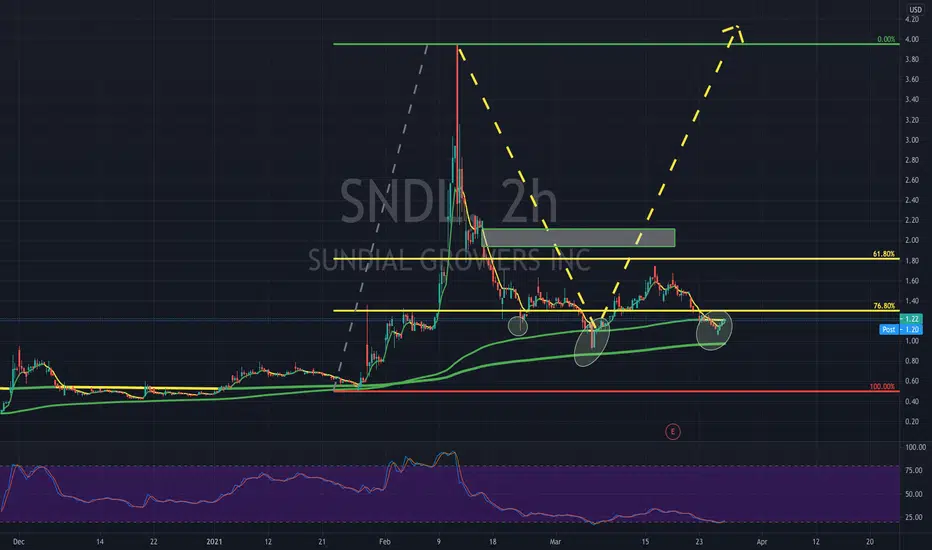
SNDL: Heading to the $ 3.96? Maybe, with 1 condition...Hello traders and investors! Again, SNDL hit the target we mentioned in our last study. Let’s see how it’ll behave now.
First, SNDL did a false breakout from the $ 1.64, and it hit our target on the same day of our last analysis, at the $ 1.47, which was a nice target to aim for, for several reasons. The link to my last public analysis is below, as usual.
Then, SNDL bounced back up to the $ 1.64 again, and it dropped. This reinforces the idea that the $ 1.64 is the most important point to keep in mind . And it is not by chance that it is the strongest resistance, and you’ll understand why when we analyze the daily chart.
But for now, keep in mind that SNDL is doing lower highs/lows, a trait of a short-term bear trend, and it seems it is heading to the $ 1.25. The earnings report did bring some volatility, but nothing as most people expected. Usually, new traders believe that the price will crash when the earnings are supposed to be bad. These people simply don't know how to apply game theory in their strategy.
Now, to the daily chart:
The $ 1.64 is the strongest resistance because it worked as a previous top in the past, and above it, there are no other meaningful resistance levels until the $ 3.96. This is why the $ 1.64 has such an important psychological meaning for SNDL.
In addition, the $ 1.64 now is a neckline, of a possible Inverted Head & Shoulders chart pattern (green area). This reinforces the idea that if SNDL defeats the $ 1.64, we’ll see it at $ 3.96, as this is the technical target for the IH&S.
The only thing we need to watch right now is if we’ll see any good candlestick/chart pattern around the $ 1.25 in the 1h chart, as this could trigger a reversal in the daily chart.
Every week I do one public analysis on SNDL, and if you want to keep in touch with my insights, remember to follow me ! And if this idea helped you, please, support it!
Thank you very much!

SNDL (NASDAQ) - Potential for BullishGreetings
Humbled, we would like to thanks for your support who has already liked, commented and followed us. Your support, strengthens us, to help in analyzing the market. If you have any questions, feel free to send us message (inbox).
Pra Trading :
- Please care for Money Management
- Have a good psychology
- Do not be hurry to open position and do not do nothing if u see opportunity
- Evaluate and upgrade your trading plan
Execution Strategy :
- Know what you want to buy, see the Fundamental
- Decide that you are on investing or speculating
- Consider what your strategy based on Investing/Speculating
- Make Road Map Of Your Trading Plan
- Decide
a. Entry strategy
b. Cut loss
c. Target of Profit
Post Trading :
a. Do not be sad if you loss or do not be very happy if you win
b. Just become a normal without emotion, Do not put emotion into your trading
c. Evaluate your trading
d. Keep on Learning
e. Be Humble
Idea :
SNDL (NASDAQ) - Potential for Bullish


$SNDL Target 2.79 for 50% Or next double level is at .93$SNDL Target 2.79 for 50%
Or next add level is at .93
I am not your financial advisor. Watch my setups first before you jump in… My trade set ups work very well and they are for my personal reference and if you decide to trade them you do so at your own risk. I will gladly answer questions to the best of my knowledge but ultimately the risk is on you. I will update targets as needed.
GL and happy trading.

Sundial Growers Stock Analysis - SNDL StockWisest Option is to hold.
Go long only if the resistance level 1.75 USD will be broken.
NASDAQ:SNDL
NASDAQ:SNDL
