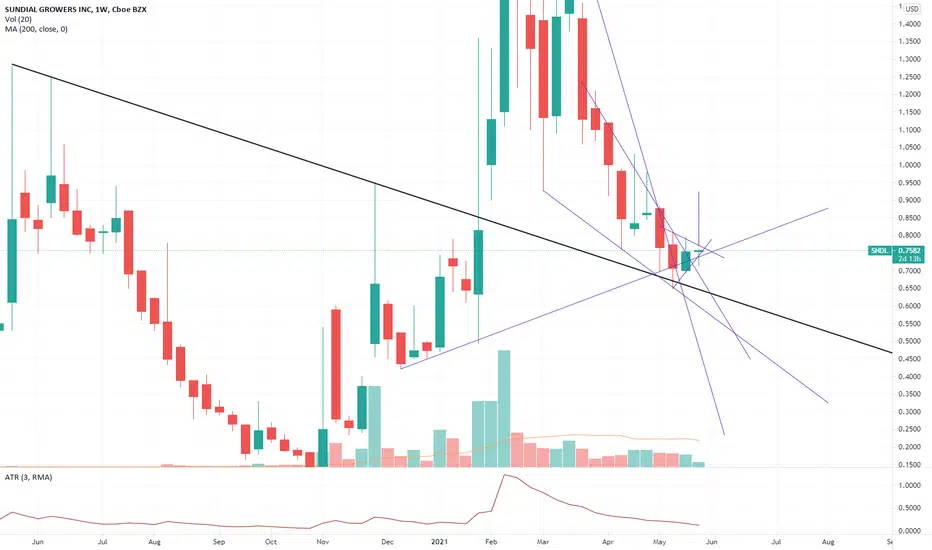
#SNDL - Weekly showing strenght and reversal signsIf we look at the weekly chart, I identified two main reasons why I consider 0.7$ being the bottom and why I think there are good chances that we can see higher levels soon:
1- Previous week candle was a piercing line candlestick pattern, with the opening below the previous candle close and with the close above the mid-body of the previous week
2- The price is reacting strongly with high volumes at the 0.72$ level, which is where most of the institutionals have their average purchasing price
In addition to this, just to estimate where the price might go by the end of this week, let's have a look at the average true range of the last 3-weeks: the price had an average extension from low to high of approximately 0.13$. This means that, starting from the assumption that the week will be a positive one, and having the low of the current week at 0.715$, this means that the price might "potentially" extend its movement up to 0.845$. This is pretty realistic and we of course hope that this will be just the beginning of the trend reversal.
Also, in the H1 chart, the head and shulder pattern that I shared few days ago, is going to complete its formation attacking the 0.795$ resistance level soon.
SNDL trade ideas
SUNDIAL GROWERS to the SUN ???Here are my Best and Worst case Scenarios for the promising stock SNDL. Of course the Stock can also follow the downward channel.
What are your thoughts on the idea?

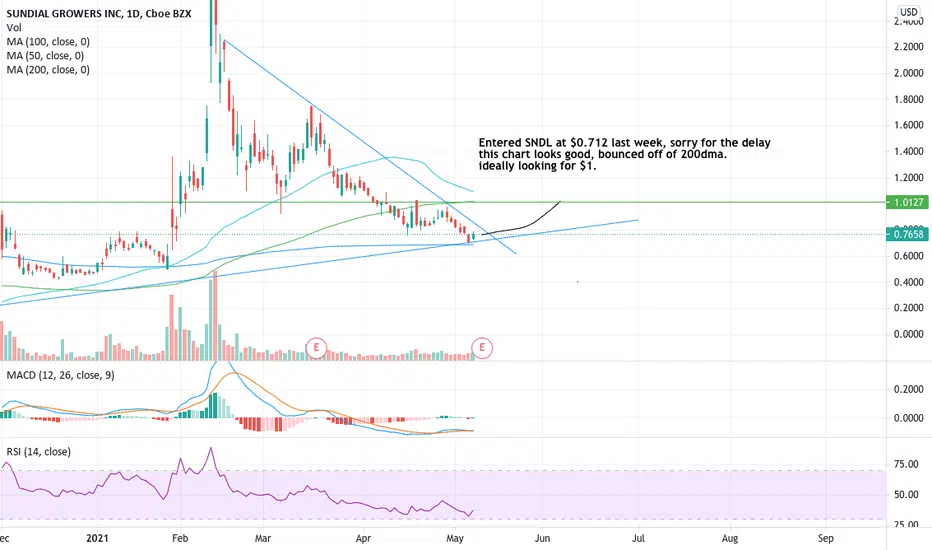
SNDL Update ...beware of slow price actionChart posted 5-24-2021 at 10:35am - This has been a pain in my side.. pesky little equity lol. However I think we continue to see the support show actual "SUPPORT". The pattern that has just drawn is a bullish one and should hopefully bring us back upside to 85 cents. I think the move may be very quick.. esp as market had some positive results today. May even take place in post market, but I think this is a good sign (if it doesnt reject). Possible rejection could be 75 cents. We want to see big moves upside quickly.. if not then the failure could be just drawing us in. Yes bullish patterns can fail.. Lets just see what happens with price action. Longer than expected price action = failure...

SNDL awesome risk/reward ratio
__________________________________________________________________________________
Please like and follow us on Tradingview and Twitter , to stay up to date our latest analysis.
Check out our Website as well, for trading tools for part and full time traders.
(Check Twitter feed for currently 30% coupon for all products)
__________________________________________________________________________________
SNDL could make another north step. I recommend others often to look for a good risk/reward ration, because you will be never 100% right. This ratio looks awesome and is worth a try!

Scenario 2 is more realistic!SNDL is maybe going to touch a new support line! Im thinking its more realistic for sndl to touch 0.6$ and then take off huge!

SNDL breakout trade !!Hello Trader,
good mood and profitable trades !
As you can see on the chart, SNDL forming a bullisht chartpattern !!
MACD : divergence an d bullish cross
RSI and STOCH: bullish divergence
TRIGGER: breakout whit confirmation on LTF or bullback
Fib bretracemant act as targets
SL if price falling back in the pattern under 0.618 , or under 1d ma20 !
Remember that things can change too .
If you like this idea , support me with likes and comments !!
Dyor and trade save !

#SNDL - Weekly chart piercing line patternThe end of the week is showing a reversal candelstick pattern: the piercing line. In fact, the week opened below the closing of the previous week and it closed abive the mid-line of the previous week. This indicates that bulls overwhelmed bears this week.
Moreover as you can see from my latest idea, there is a reversal head and shoulder formation in the H1 timeframe, with neckline at 0.795$.
I am extremely confident that this line of resistence will be broken next week and the bullish trend reversal will start


SNDL update: i think it found its bottom; it way up from here.
my first plot was wrong thinking it can just go sideways inside the DSI support box, but it pierced through and found its bottom.
MACD confirmed bullish daily trend, but not completely. til it passes through the histograms and stay above it, then yes.
RSI market structure for 7 days showed; confirmed OVER BOUGHT so its just gonna trend up from here.
0.766 once it passes that and stayed above that, no down trend for us bois.. it will be going sideways on that box and will try to break out. thats the sideways i was plotting at first

#SNDL - Fun has finished for bears. H4 showing reversal signsLong story short: H4 chart is shwing a H&S reversal pattern which will be confirmed in the next hourly sessions, by breaking the neckline at .795$. In my opinion there are good chances to see a runaway gap above this level tomorrow FRI 20th.
Target for this technical pattern is 0.92$, while 0.85$ is the target for the green channel that you can also see in the chart.
Longer term, next target will be 1.4$, which is the falling wedge target in red. After that level is reached.... only highways..
Good luck!
-- THIS IS NOT A FINANCIAL ADVICE --

Invest in Cannabis while you can.Sector rotation is real and cannabis has been off the radar for a long time.
I can feel it in my bones. Even if the cannabis stocks sell off with the broader market, they will most likely outperform on the upside.
Also did I mention the breakout and retest on the rsi + the divergence after all that. I'm curious how the whole dang thing looks kinda like a reverse h&s.
(Not financial advice)

SNDL Recap- not much to shareThere is not much to report here yet, we have seen a positive bounce, but very little price action. It almost looks like its been halted for entire days.. but each opening bell things go higher. Right now seems we could be at a top- or a support line to go higher on a bullish pattern. I am not inclined to make a call right now. People keep asking me- so this chart is to speak to that. There really is not much to show. The chart here just gives you an idea of what may happen... but without price action its impossible to say what may develop. Hopefully this helps some.. shrugs. As things develop more maybe I will have more to share.. but blame it on price action being null on SNDL right now.


Devils threeway lettuce Update *updated*I haven't updated this one in a minute.
My SNDL pitchfork battle has been won by the 3M trend. SNDL in the top channel and I do not have any hope for a break out until a gap is possibly filled around .40 and around .24... or if this thing gets super positive news, because regular news does nothing for SNDL.
let me just say, "brace yourself for a sub .50... then possibly sub .20 again."
not financial advice, this is pseudoscience.

SNDL BUY/LONG NOW READY! (LAST CALL FOR ENTRY) 0.7-3.00TICKER CODE: SNDL
Company Name: Sundial Growers Inc.
Industry: Healthcare | Drug Manufacturers - Specialty & Generic | Canada
Position Proposed: BUY
Technical Analysis
1. Large Head & Shoulders
2. Fibonacci Retracement at 0.786 (Silver Zone)
3. Falling Wedge Completed
4. 1st Take Profit will hit the key Impulse of the massive sell
Entry: Now Ready (0.65-0.7)
1st Partial Take Profit: 3.00
2nd Take Profit: 4.10
Expected Take Profit in July - December 2021

#SNDL - 4H chart showin RSI divergence & much moreThe H4 timeframe is suggesting interesting points which make still think that we are close to a rebound; as I recently shared, the 0.7$ area is extremely important has it is where three important trendlines are crossing (this is not visible frm this chart).
Summarizing my points:
1- RSI showing divergence with price action, and it is rebounding for the third time in oversold territory
2- Falling wedge broken on April 19th with volumes
3- Today closing H4 candle is a piercing line candle, which opened below the lower of the previous candle, and closed approximately at half of the body of the same previous handle.
Not visible from this chart, if yu have a look at the monthly candles, you'll see that the last three bearish candles have lower volumes, and this is a strong sign to me, that we are just few days/weeks away from recoverying an uptrend with higher volumes.

#SNDL - 4H chart showing a critical reaction pointH4 charts shows how three main trendlines meet at 0.7$ point, exactly where the price is bouncing now.
The purple line, the black line and the green line all meet at this point.
I would not be surprised to see a reaction tomorrow from these current levels, and a second/third and fourth week of May definitely bullish, in my personal opinion!

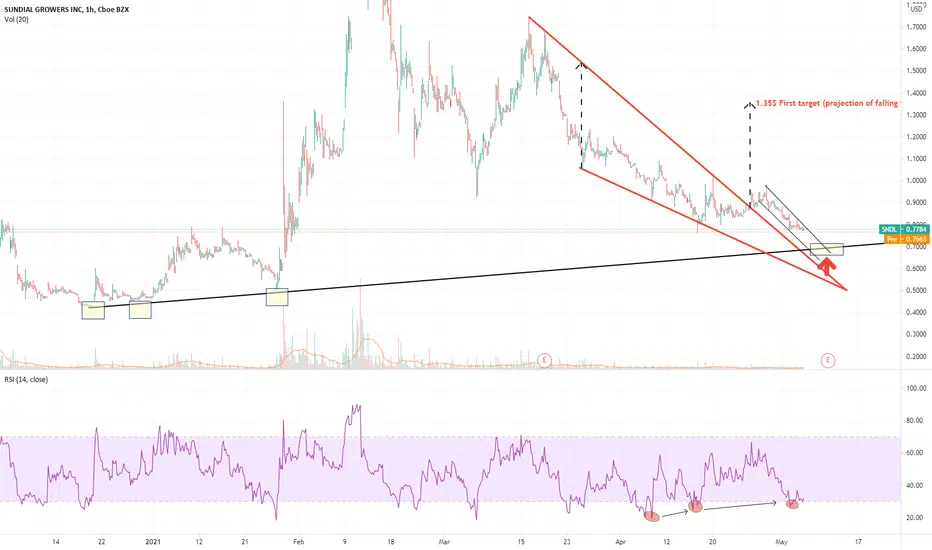
#SNDL - Falling Wedge in H1 broken with volume! #SNDL is in my opinion very close to reverse the downtrend. Possible rebounce area at 0.7$, if not happening before. The one hour chart is showing a falling wedge being broken - with volumes - on April 27th and the price is now retracing looking for a pullback.
Very interesting to see how this bullish wedge pattern is also supported by an RSI divergence: so, basically, the RSI shows higher lows, while the prices are showing lower lows. This is pretty indicative of the fact that sellers are loosing momentum. The target of the falling wedge stands at 1.35$, but I am pretty convinced that once we reach the 1.3$ again, we'll not be seeing the bottom under 1$ anymore.
SNDL Update! Just picking more. Neutral trend for sndl until nowSNDL is more closer to the floor now! Im buying more at 0.65$ , 0.6$.

SNDL IdeaSmall description on chart, I am NOT a financial advisor please DYODD. This is just my opinion
SNDLSundial Growers Inc (NASDAQ:SNDL) Potential short-term reversal trend here. Momentum is coming back to this name. Might be worth watching for a new move to the upside.

SNDL has a huge potential for a big squeez > 25 $ perfect time to jump in Sndl stock. This stock is one of cheapest long term stock in cannabis market that is really undervalued right now. Maybe it will go a little bit more down but in compare the huge opportunity it worth to buy in these prices.

SNDL; the 200 EMA kissWe are about to "kiss" the daily 200 EMA line again with a familiar pattern leading into it as well.
Sellers have had a very successful run BUT still have not made a "lower-low" after SNDL's quick surge to ~$5
This may be the time for bears to finally make a new low, or it could mean it's to time take a page out SNDL's history book and blast off once more.
Let's see what happens!
