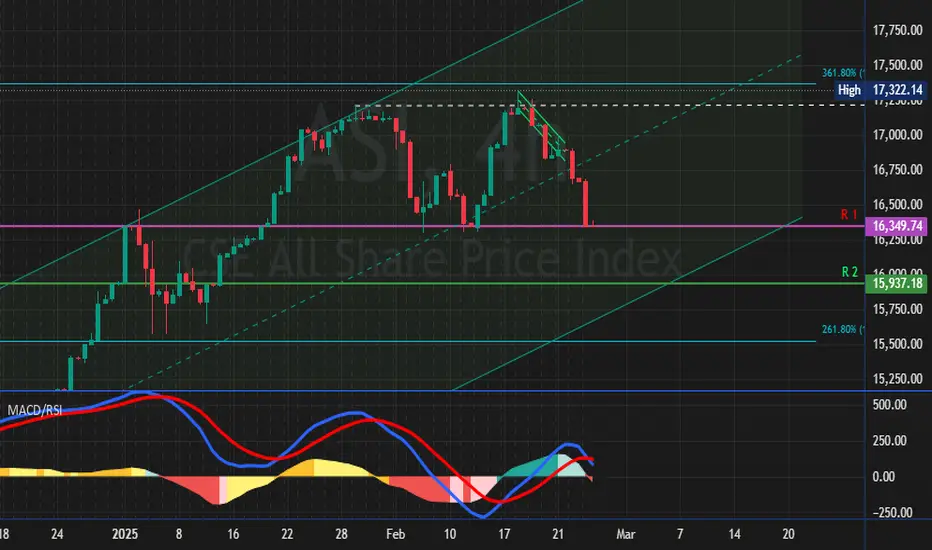
CSE ASI BEARISH SETUPThe monthly chart of the CSE All Share Price Index (ASI) reveals a technically significant scenario: the index is currently testing the upper boundary of a long-term ascending channel while also aligning with the 1.618 Fibonacci extension, both of which signal potential reversal pressure ahead.
Key
Related indices

ASPI CSEDisclaimer;
The information provided on this website does not constitute investment advice, financial advice, trading advice, or any other advice, and you should not treat any of the website’s content as such. We do not recommend buying, selling, or holding any stock. Nothing on this website should

ASIDisclaimer
The information provided on this website does not constitute investment advice, financial advice, trading advice, or any other advice, and you should not treat any of the website’s content as such. We do not recommend buying, selling, or holding any stock. Nothing on this website should

ASPI CSEDisclaimer;
The information provided on this website does not constitute investment advice, financial advice, trading advice, or any other advice, and you should not treat any of the website’s content as such. We do not recommend buying, selling, or holding any stock. Nothing on this website should
Weekly ASI Performance AnalysisWeekly Close
Market had a weekly close above level 3, the last horizontal resistance before testing all time high again.
Incidentally market reached the target of the pattern, of which breakout happened on April 24th, 2025.
What Next:
We continue to remain bullish on the ASI/CSE and believ

Update! 1st Quarter Nigerian Share Picks for 2025 (DEC30-MAR31)We analyzed the price movement of 17 publicly listed company shares, comparing their old prices by Dec30th with new prices by end of quarter. This comparison reveals how each stock performed over the given period and helps assess the general market sentiment across this portfolio.
Statistical Summa

ASI - CSELKDisclaimer
The information provided on this website does not constitute investment advice, financial advice, trading advice, or any other advice, and you should not treat any of the website’s content as such. We do not recommend buying, selling, or holding any stock. Nothing on this website should

ASI Update - 17/02/2025🔹 The ASI Index remains in a strong uptrend, with bullish momentum pushing prices towards major resistance zones.
Key Levels to Watch:
✅ Resistance:
17,837 → 1.618 Fibonacci Extension and a critical resistance level.
17,093 - 17,092 → Short-term resistance before Fib extension.
🔻 Support:
16,728

All Share Index (ASI) Movement after weekly MACD crossingColombo Stock Exchange (CSE) All Share Index (ASI) Movement after weekly MACD crossing
Based on last 5 cycles
Avg. Upside since weekly MACD crossing = 41.12%
Avg. duration of upward move since weekly MACD crossing = 109.6 Days

ASI - Bull cycle for stock market in Sri lankaLong term targets for ASI indicated in above chart.
Disclaimer: The information and analysis provided in this publication are for educational purposes only and should not be construed as financial advice or recommendations to buy, sell, or hold any securities. The author and TradingView are not res

See all ideas
Summarizing what the indicators are suggesting.
Oscillators
Neutral
SellBuy
Strong sellStrong buy
Strong sellSellNeutralBuyStrong buy
Oscillators
Neutral
SellBuy
Strong sellStrong buy
Strong sellSellNeutralBuyStrong buy
Summary
Neutral
SellBuy
Strong sellStrong buy
Strong sellSellNeutralBuyStrong buy
Summary
Neutral
SellBuy
Strong sellStrong buy
Strong sellSellNeutralBuyStrong buy
Summary
Neutral
SellBuy
Strong sellStrong buy
Strong sellSellNeutralBuyStrong buy
Moving Averages
Neutral
SellBuy
Strong sellStrong buy
Strong sellSellNeutralBuyStrong buy
Moving Averages
Neutral
SellBuy
Strong sellStrong buy
Strong sellSellNeutralBuyStrong buy
Displays a symbol's price movements over previous years to identify recurring trends.