Shentu On The Verge Of A Bullish Breakout —150% Short-Term MoveJust a few months ago, in May, CTKBTC (Shentu) produced a small reversal pattern and suddenly grew by more than 150% in a single day.
Present day, we have the same pattern but this time much bigger. We have a reversal pattern after a multiple months long correction that led to a lower low compared to the start of the last bullish jump.
Coming out of a lower low and the reversal pattern being bigger and longer this time can produce an even stronger bullish jump.
CTKBTC is now bullish and the chart shows bullish potential with a breakout likely to happen any day. It can happen tomorrow just as it can happen today. Just as it can take a week or two, allow some variations because market conditions can always change.
This is a short-term move that I am mapping on this chart.
Thank you for reading.
Namaste.
CTKBTC trade ideas

Trade Signal for CTKBTC: SELLDirection: Sell
Enter Price: 9.01E-06
Take Profit: 8.76E-06
Stop Loss: 9.49E-06
Analysis & Justification :
This signal has been generated using the EASY Quantum Ai strategy, which considers a mix of technical indicators and market sentiment analysis. Currently, the CTKBTC pair shows signs of a downward trend, influenced by the following factors:
1. Technical Indicators: Key moving averages are indicating a bearish crossover, reinforcing the sell position. Oscillators show a weakening momentum, suggesting that the pair might continue to decline.
2. Market Sentiment: Recent market events have contributed to negative sentiment around the CTK token versus BTC, potentially driving the pair lower.
3. Resistance Levels: The pair recently failed to break through a strong resistance zone, which has historically led to downward pressure.
4. Volume Analysis: Trading volumes are suggesting a bearish momentum, with increased sell-offs at recent high points.
Traders should proceed with caution and respect the prescribed entry, take profit, and stop loss levels. This recommendation aligns with the recent pattern analysis and should be monitored closely for any market shifts.

CTK/BTC - CertiK: BBand_Breakout◳◱ A Bollinger Band breakout has been identified on the $CTK / $BTC chart. The price has moved outside of the upper Bollinger Band, indicating a potential bullish trend. The next resistance key levels are located at 0.00002876 | 0.00003009 | 0.00003253, and the major support zones can be found at 0.00002632 | 0.00002521 | 0.00002277. Consider buying at the current price zone of 0.00002827 and targeting higher levels.BBand_Squeeze
◰◲ General info :
▣ Name: CertiK
▣ Rank: None
▣ Exchanges: Binance, Hitbtc
▣ Category/Sector: Infrastructure - Smart Contract Platforms
▣ Overview: None
◰◲ Technical Metrics :
▣ Mrkt Price: 0.00002827 ₿
▣ 24HVol: 7.173 ₿
▣ 24H Chng: 3.705%
▣ 7-Days Chng: N/A
▣ 1-Month Chng: N/A
▣ 3-Months Chng: N/A
◲◰ Pivot Points - Levels :
◥ Resistance: 0.00002876 | 0.00003009 | 0.00003253
◢ Support: 0.00002632 | 0.00002521 | 0.00002277
◱◳ Indicators recommendation :
▣ Oscillators: NEUTRAL
▣ Moving Averages: STRONG_BUY
◰◲ Technical Indicators Summary : BUY
◲◰ Sharpe Ratios :
▣ Last 30D: N/A
▣ Last 90D: N/A
▣ Last 1-Y: -1.38
▣ Last 3-Y: -0.43
◲◰ Volatility :
▣ Last 30D: N/A
▣ Last 90D: N/A
▣ Last 1-Y: 1.05
▣ Last 3-Y: 1.19
◳◰ Market Sentiment Index :
▣ News sentiment score is N/A
▣ Twitter sentiment score is 0.70 - Bullish
▣ Reddit sentiment score is 0.84 - V. Bullish
▣ In-depth CTKBTC technical analysis on Tradingview TA page
▣ What do you think of this analysis? Share your insights and let's discuss in the comments below. Your like, follow and support would be greatly appreciated!
◲ Disclaimer
Please note that the information and publications provided are for informational purposes only and should not be construed as financial, investment, trading, or any other type of advice or recommendation. We encourage you to conduct your own research and consult with a qualified professional before making any financial decisions. The use of the information provided is solely at your own risk.
▣ Welcome to the home of charting big: TradingView
Benefit from a ton of financial analysis features, instruments and data. Have a look around, and if you do choose to go with an upgraded plan, you'll get up to $30.
Discover it here - affiliate link -

$CTK/#BTC [#CertiK]: Resistance and BBand_Breakout◳◱ Hey traders, we've identified bullish signals on the $CTK / $BTC chart through the detection of both a Bollinger Band breakout and a Resistance Breakout. The Bollinger Band indicates a potential bullish trend as the price has moved outside of the upper band, while the Resistance Breakout confirms this trend by showing the price breaking above a key resistance level. Given the alignment of these signals, it may be a good idea to consider entering a long position and targeting higher levels. Our analysis indicates that the key resistance levels are at 0.000035 | 0.00003685 | 0.00003965 and the major support zones are at 0.0000322 | 0.00003125 | 0.00002845. However, it is important to also consider other factors such as overall market conditions and other technical indicators before making a trade decision.
◰◲ General info :
▣ Name: CertiK
▣ Rank: None
▣ Exhanges: Binance
▣ Category/Sector: Infrastructure - Smart Contract Platforms
▣ Overview: None
◰◲ Technical Metrics :
▣ Mrkt Price: 0.00003675 ₿
▣ 24HVol: 15.380 ₿
▣ 24H Chng: 6.46%
▣ 7-Days Chng: N/A
▣ 1-Month Chng: N/A
▣ 3-Months Chng: N/A
◲◰ Pivot Points - Levels :
◥ Resistance: 0.000035 | 0.00003685 | 0.00003965
◢ Support: 0.0000322 | 0.00003125 | 0.00002845
◱◳ Indicators recommendation :
▣ Oscillators: BUY
▣ Moving Averages: STRONG_BUY
◰◲ Technical Indicators Summary : BUY
◲◰ Sharpe Ratios :
▣ Last 30D: N/A
▣ Last 90D: N/A
▣ Last 1-Y: -0.66
▣ Last 3-Y: -0.43
◲◰ Volatility :
▣ Last 30D: N/A
▣ Last 90D: N/A
▣ Last 1-Y: 1.03
▣ Last 3-Y: 1.19
◳◰ Market Sentiment Index :
▣ News sentiment score is N/A
▣ Twitter sentiment score is 0.87 - V. Bullish
▣ Reddit sentiment score is 0.60 - Bullish
▣ In-depth CTKBTC technical analysis on Tradingview TA page
▣ What do you think of this analysis? Share your insights and let's discuss in the comments below. Your like, follow and support would be greatly appreciated!
◲ Disclaimer
Please note that the information and publications provided are for informational purposes only and should not be construed as financial, investment, trading, or any other type of advice or recommendation. We encourage you to conduct your own research and consult with a qualified professional before making any financial decisions. The use of the information provided is solely at your own risk.
▣ Welcome to the home of charting big: TradingView
Benefit from a ton of financial analysis features, instruments and data. Have a look around, and if you do choose to go with an upgraded plan, you'll get up to $30.
Discover it here - affiliate link -

CertiK (CTK) coin formed bullish Gartley for upto 13.50% moveHi dear friends, hope you are well and welcome to the new trade setup of CertiK (CTK) coin with Bitcoin pair.
On a 4-hr time frame, CTK has formed a bullish Gartley pattern.
Note: Above idea is for educational purpose only. It is advised to diversify and strictly follow the stop loss, and don't get stuck with trade

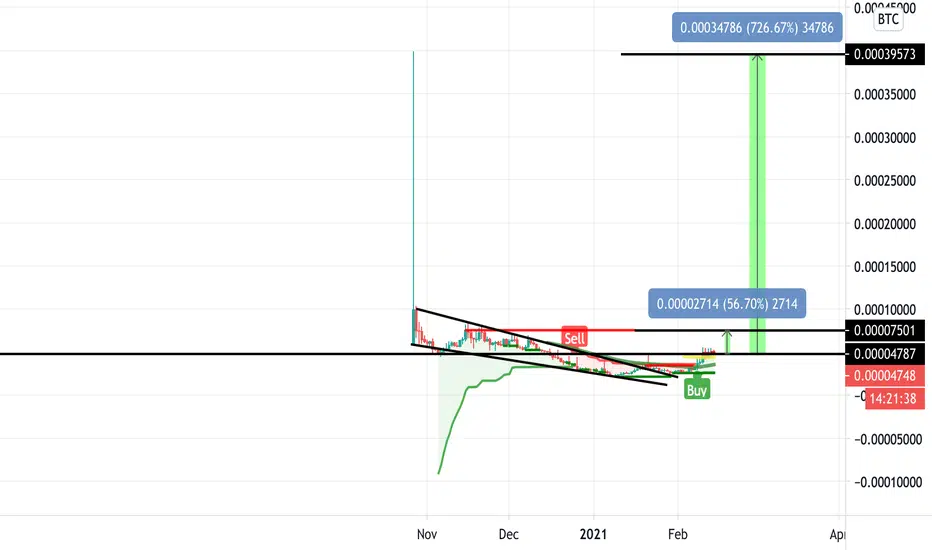
going long on vtk/btcctk/btc has been moving in a descending triangle since the chart started on tradingview and I'm looking for a breakout of the yellow trendline to the upside. The short-term target would be 0.00008269 and long-term target around 0.00040103 after the breakout. very bullish chart in my opinion ...


CTK/BTC buy opportunityBINANCE:CTKBTC is moving sideways for a while, but due to the higher low formed recently, a breakout above 0.000038 area will be considered very bullish and may trigger the next big move up.
Don't forget to manage your risk! 👌
Good luck and trade with care 🙏
If you like my content - 👍 Like, 💬 comment, 👆 follow and 👉 share!
❗❗❗
Disclaimer: This information is not a recommendation to BUY or SELL. It is to be used for educational purposes only!

CertiK CTK breaking out 💪 Certik CTK a midsize market cap with Circulating Supply 4M of 100M is breaking out above both 50 EMA and 100 EMA at the same time after a very long consolidation with increasing bullish volume over the time.
How high will it go? What do you think? Feel free to share your thoughts.


Try me first!Good day, wolves🔥
There is one more interesting formation for this week
Descending triangle formation on CTK/BTC crypto pair.
There was a strong bearish trend before this consolidation.
Breaking this hard resistance level will be a fresh breath for ths crypto.
Let's follow the chart and look for the best price to enter carefully.
_____________________________________________________
If you enjoy my FREE Technical Analysis , support the idea with a big LIKE👍 and don't forget to SUBSCRIBE my channel, you won't miss anything!
Feel free to leave comments✉️
And always remember: "we don't predict, we react".

CTK: 9k - 13k - 20k - 25k - 30k stsCertiK is not bad project!
We can expect these price levels: 9k - 13k - 20k - 25k - 30k sts


CTKBTCSPOT (BINANCE)
#CTKBTC SHORT TERM HOLD
BUY BELOW : 5135-5050
Target : 5475|5800|6140➕🚀
Short Term👌


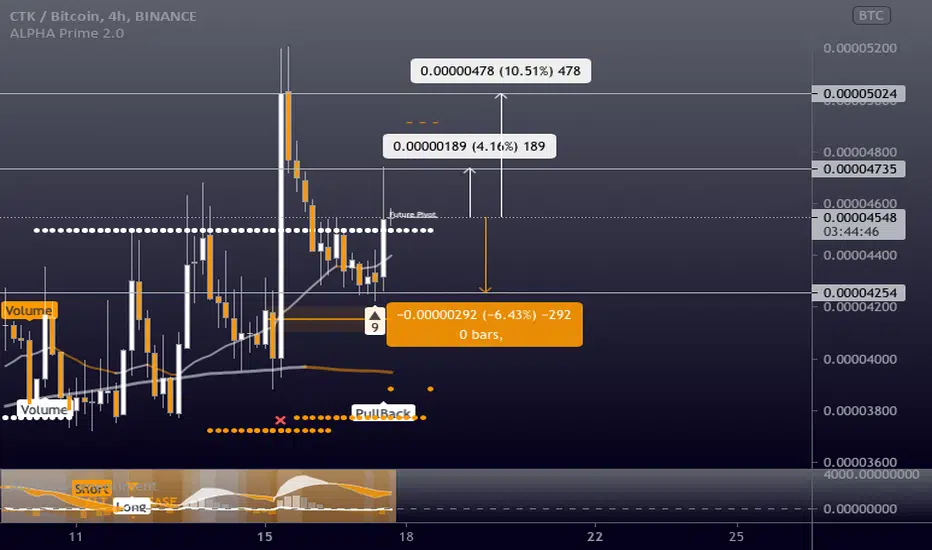
CTKBTC - Long - Potential 10.51%CTKBTC - Long - Potential 10.51%
Exchanges: Binance
Signal Type: Regular (Long)
Entry Zone:
0.00004454 - 0.00004548
Take-Profit Targets:
1) 0.00004735
2) 0.00005024
Stop Targets:
1) 0.00004254
Trailing Configuration:
Entry: Percentage (0.0%)


CTK will explode soonYOUR LIKE OR COMMENT IS MY FUEL FOR NEXT ANALYSIS :) IF U HAVE ANY QUESTION REACH ME HERE
This is not a financial advice. Always do your own research and always put stoploss in your trade (SL) :) If you want more detailed info how to study and read charts or just need help with some coin, just write to me here a comment, i will try to answer to everybody... i can help you :) all for free, don't worry, BE HAPPY!
********************************************CHECK MY LATEST ANALYSIS DOWN BELOW********************************************

$CTKPerfect time to by CTK here. This one is for the patient ones. We may never see these levels again.
FA:
* Strong project with strong team. Just check the about page certik.io
* CertiK unites exceptional talent by sourcing employees from the best universities and companies across the world: Yale, Columbia, University of Chicago, Penn State, Princeton, NYU and so on.
* One day, all projects out there will use certik to verify their blockchains.
* CertiK partnered with #BinanceSmartChain to #BUILD a secure ecosystem as the only #security partner in the #BSC MVB Accelerator Program.
TA:
* The chart look similar to XVS chart just before the moon mission.
* Hasn't pumped yet since listing.
* Current price is under the listing price and it is previous support where it bounced.
* So many wicks around 5500 sats. It's acting as resistance. Once we pass that, second resistance is around 7500, then clear skies.
* This is a long term HODL project.So, I won't sell it until I see that %700.
*On daily:
* RSI looks good, bullish MACD
* Price is sitting on 200 EMA
* Falling wedge is broken.
* USDT chart is already mooning. It may follow the USDT pair.
* On 4HR: Perfect 50-100-200 EMA alignment, bullish MACD, Bullish RSI