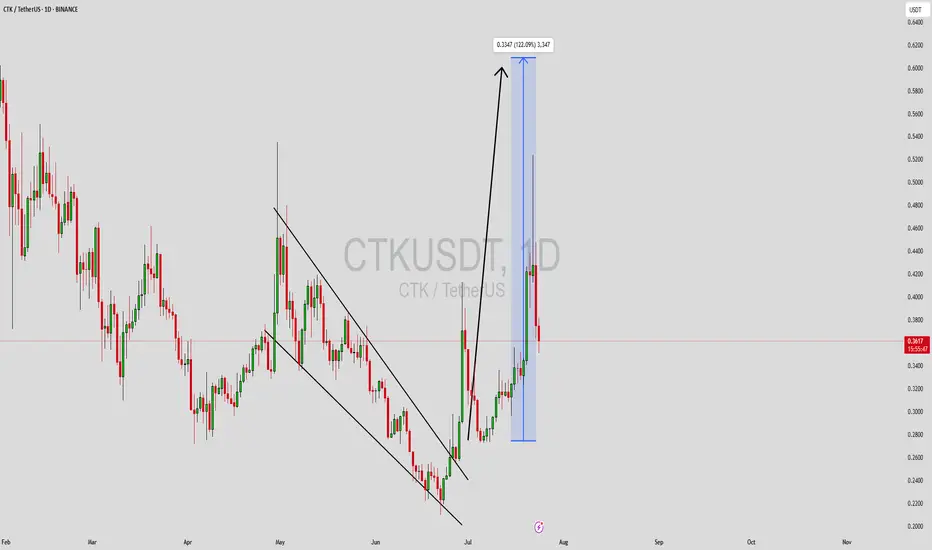
CTKUSDT Forming Falling WedgeCTKUSDT is currently trading within a well-defined falling wedge pattern, a classic technical indicator that often signals a bullish breakout. The structure reflects a period of consolidation after a prolonged downtrend, with gradually narrowing price action hinting at a potential reversal. Volume r
Ctk uzun vade trend kırılımı ve direnç üstü hedefler..Who will wake up this long-dormant monster? Trend break? Resistance break? Or both?
CTKUSDT 1DKeep an eye on #CTK on the daily timeframe.
It’s on the verge of breaking above the descending resistance and the Ichimoku cloud.
In case of a breakout, the targets are:
🎯 $0.4698
🎯 $0.5500
🎯 $0.6302
🎯 $0.7445
⚠️ Always use a tight stop-loss and apply proper risk management.

CTKUSDT at Critical Retest After Major Trendline Break!CTK/USDT has successfully broken out of a long-term descending trendline that has dominated the price since November 2024, signaling a potential trend reversal from bearish to bullish. The price is now retesting a crucial supply-turned-demand zone in the $0.36 - $0.39 area, which now acts as new sup

CTKUSDT Swing Trade Setup – Bottom Confirmed, Uptrend in Progres🔔 CTKUSDT Swing Trade Setup – Bottom Confirmed, Uptrend in Progress
Market Context:
CTK has completed its W-shaped bottoming process, retracing over 80% from the high of $0.98 to the bottom at $0.213. After multiple sessions of accumulation around the $0.213 area, price has gradually recovered to $

CTKUSDT UPDATE
Pattern: Falling Wedge Breakout
Current Price: \$0.2713
Target Price: \$0.61
Target % Gain: 130%
Technical Analysis: CTK has broken out of a long-term falling wedge on the 1D chart with strong bullish candles. The breakout is supported by a noticeable increase in momentum, suggesting potential co

CTKUSDT Forming Strong Bullish ReversalCTKUSDT is currently displaying a strong bullish reversal setup with a well-formed falling wedge pattern on the chart. This classic pattern is known for signaling a potential breakout after a period of consolidation and downward pressure. As the price approaches the apex of the wedge with increasing

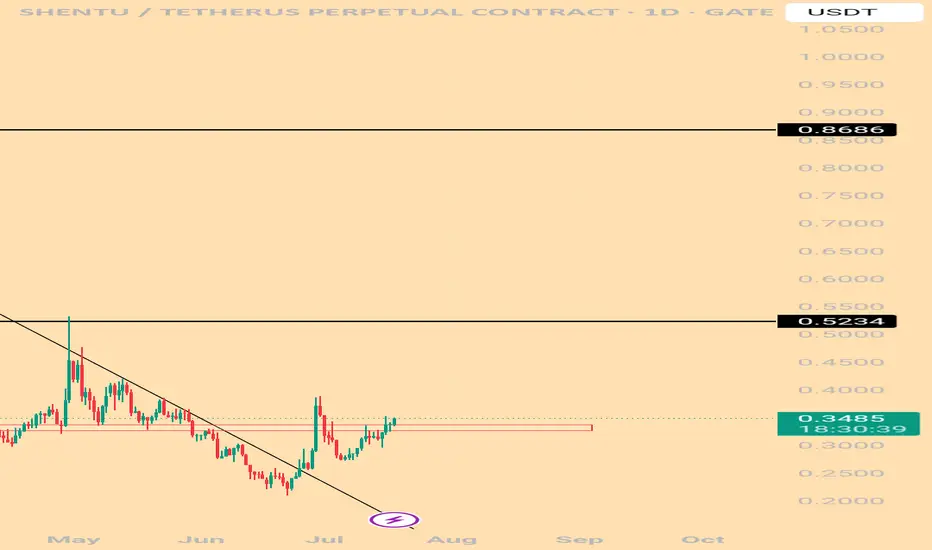
Shentu Back To Baseline, 200% Minimum, Fast!We have a very good chart setup here but I will focus on one target only and the short-term, "back to baseline."
Shentu is about to make a strong jump. One of those that can leave us with our mouths wide open. Similar to 30-April but without the rejection and lower low.
This time, the jump will re

Shentu Recovering From New All-Time Low (645% Easy Target)Shentu (CTKUSDT) is pretty interesting right now and good looking from a TA perspective, the bottom is in.
This week is just starting and CTKUSDT trades full green, moving at the upper limit of the candle.
After a new All-Time Low, same date, 7-April, all the sessions closed green. Three consecutiv

CTKUSDT | Critical Resistance Levels ConfirmedCTKUSDT is currently testing a key resistance area, and the blue boxes have proven to be robust resistance levels. These zones have consistently repelled upward movement, indicating strong selling pressure at these levels.
Key Observations
• Strong Resistance Areas: The blue boxes mark critical poi

See all ideas
Summarizing what the indicators are suggesting.
Oscillators
Neutral
SellBuy
Strong sellStrong buy
Strong sellSellNeutralBuyStrong buy
Oscillators
Neutral
SellBuy
Strong sellStrong buy
Strong sellSellNeutralBuyStrong buy
Summary
Neutral
SellBuy
Strong sellStrong buy
Strong sellSellNeutralBuyStrong buy
Summary
Neutral
SellBuy
Strong sellStrong buy
Strong sellSellNeutralBuyStrong buy
Summary
Neutral
SellBuy
Strong sellStrong buy
Strong sellSellNeutralBuyStrong buy
Moving Averages
Neutral
SellBuy
Strong sellStrong buy
Strong sellSellNeutralBuyStrong buy
Moving Averages
Neutral
SellBuy
Strong sellStrong buy
Strong sellSellNeutralBuyStrong buy
Displays a symbol's price movements over previous years to identify recurring trends.