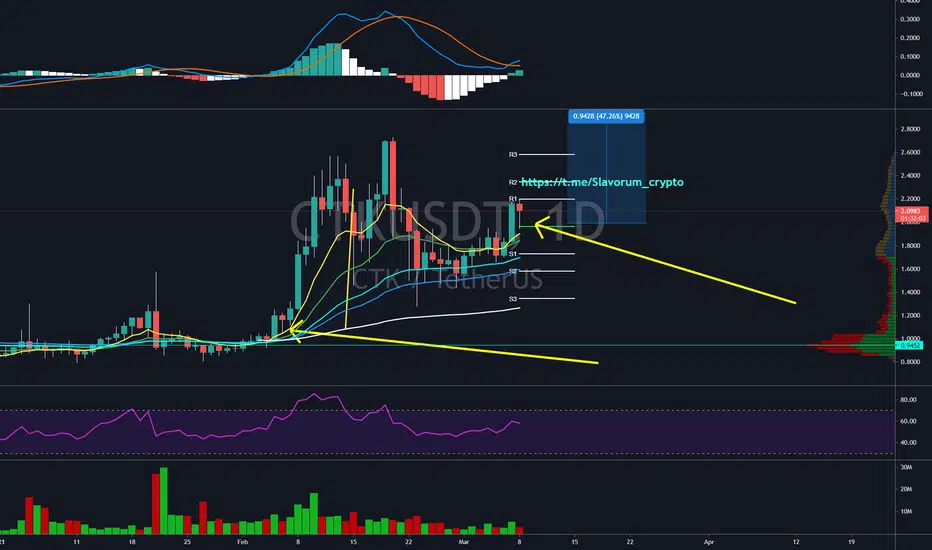
CTK USDT Breakout expected in 1-2 weeksThis coin has last breakout with a regular period of time
Its now again at support level
It should breakout till 1st resistance which is 1.08
If 1st resistance breaks then 40-50% breakout is expected
Stay calm and stay safe
CTKUSDT trade ideas


CTKUSDT is testing the daily resistance 🦐The price is testing the daily resistance after a nice bullrun. IF the price will have a breakout from 4h resistance and retest the daily support, According to Plancton's strategy (check our Academy), we can set a nice order
–––––
Follow the Shrimp 🦐
Keep in mind.
🟣 Purple structure -> Monthly structure.
🔴 Red structure -> Weekly structure.
🔵 Blue structure -> Daily structure.
🟡 Yellow structure -> 4h structure.
⚫️ Black structure -> <4h structure.
Here is the Plancton0618 technical analysis, please comment below if you have any question.
The ENTRY in the market will be taken only if the condition of the Plancton0618 strategy will trigger.


🔥 CTK Megaphone PatternCTK has produced a nice bullish megaphone pattern over the last couple of days. With Bitcoin consolidating a bit, there's a chance that CTK will continue this pattern in the near tern.
Happy trading!

CTK: Can this go upCTK daily chart shows the price is been in a range for more than a month.
Yesterday it tried to go up and couldn't get a daily close above this box.
If BTC holds then we can see price closing above this box in coming days and then zoom.
You can either enter now or buy on a daily close above this box or buy on breakout and retest of the box.
target 1: 4.5$
target 2 : open (as price will be on discovery mode)


CTK similarity?
YOUR LIKE OR COMMENT IS MY FUEL FOR NEXT ANALYSIS :) IF U HAVE ANY QUESTION REACH ME HERE
This is not a financial advice. Always do your own research and always put stoploss in your trade (SL) :) If you want more detailed info how to study and read charts or just need help with some coin, just write to me here a comment, i will try to answer to everybody... i can help you :) all for free, don't worry, BE HAPPY!
********************************************CHECK MY LATEST ANALYSIS DOWN BELOW********************************************


CTK - Could be a start of New RallyI am following this coin for a while. This coin is one of the strong coins, I hope we might see some good profits in next few days. We can see a lot of scam wicks for this coin too. So, Stop Loss should be applied on 1 hr candle close for safety. I think we might see some Bullish MA cross in coming days and that could push the prices up.
Entry - 1.68
TP1- 1.829
TP2- 2.16
TP3- 2.41-2.71 USD
SL - Below 1.27 (1Hr Candle Close)


CTKUSDT ON BEARISH SIDEIF THIS CURRENCY CAN BREAK RED PIVOT
my targets are 38% and 5% of fibo retracement

CTK USDTBuy zone for CTK between 1.25 -- 1.4 ( potential wick to 1.15 )
TP : 1.55 - 1.6 - 1.65 - 1.7 - 1.75 --- 1.8 +++
DWYOR and Good Luck
free tips are welcome :
TRC20 : TRFgzA4pWt5TzW4MzAC7sbDsKPRgHRoNNU


