Cartesi Early Reversal Signals: 700%-900%+ Growth PotentialCartesi hit bottom...
My friend, it is my pleasure to write again for you.
➖ CTSIBTC hit the lowest price since February 2021. Needless to say, the support range that contains this price level launched the 2021 major bull-run, are we setting ourselves up for the same? Yes!
➖ Cartesi just hit bottom and I can tell because of the 'volume breakout' and strong green candle on the chart. The volume breakout and green candles are happening after two reversal candlestick showed up.
These are reversal signals. After years of prices moving down, years of consolidation, we are ready for growth.
We are looking at a true bottom and this means that we have huge potential for growth. A new All-Time High is possible but here I am only showing a few targets because 700% and 900% is more than enough.
I am wishing you success, health, wealth, profits and fun.
Namaste.
CTSIBTC trade ideas

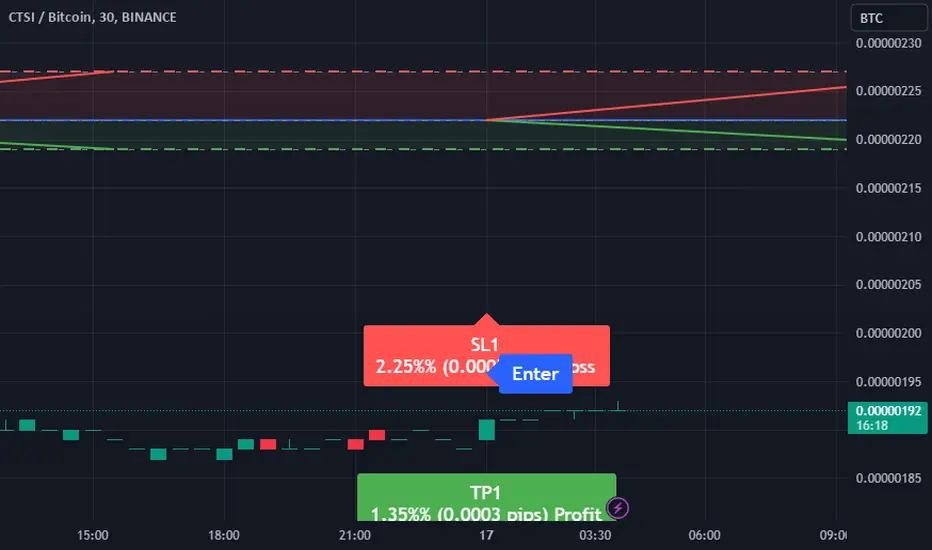
Trade Signal: CTSIBTCDirection: Sell
Enter Price: 2.22E-06
Take Profit: 2.19E-06
Stop Loss: 2.27E-06
This trade signal is generated based on the EASY Quantum Ai strategy, which utilizes a combination of technical analysis indicators and market sentiment. The decision to initiate a sell position for the CTSIBTC currency pair at an entry price of 2.22E-06 is influenced by several key factors:
1. Trend Analysis: Recent analysis shows a downward trend in the pair, indicating sustained bearish momentum. This aligns with historical resistance levels encountered around the current price point.
2. Market Sentiment: Negative sentiment has been observed among traders, suggesting increased likelihood of selling pressure. This includes a decline in positive news events and market confidence related to this pair.
3. Technical Indicators: Indicators such as the Relative Strength Index (RSI) and Moving Averages are signaling overbought conditions, implying potential for a price correction.
The specified Take Profit level at 2.19E-06 ensures a targeted exit point for capturing gains, while the Stop Loss at 2.27E-06 safeguards against unexpected market reversals. Always conduct thorough risk management while executing trades.
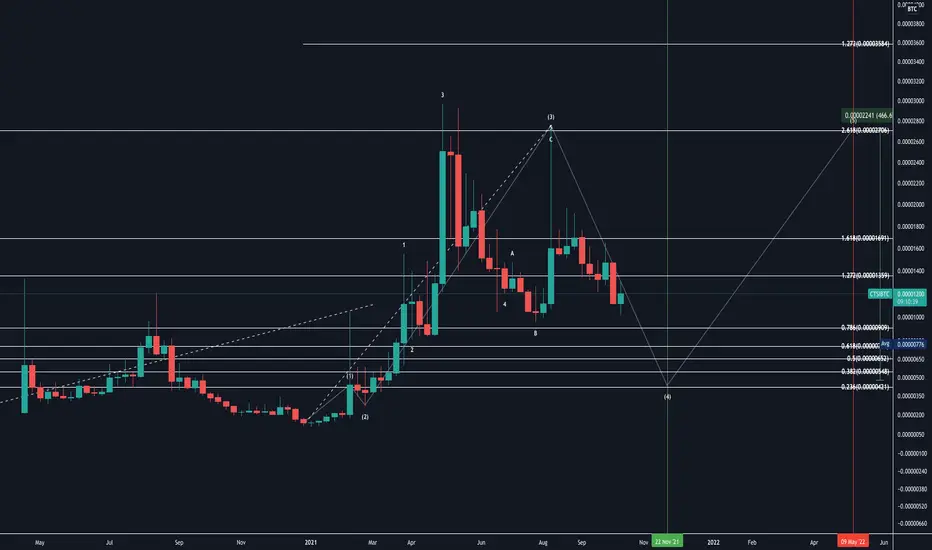
✳️ Cartesi | Classic Bullish Signals (Bull-Market All-Time High)Let's look at Cartesi long-term vs Bitcoin - CTSIBTC- and where prices are likely to end at the next market peak.
First, let's look at some classic signals:
➖ Long-term higher low (clearly depicted on the chart).
➖ Strong RSI (a reading of 58).
➖ Trading above EMA10 and EMA50 (weekly timeframe).
➖ Bottom formation, a cup pattern (this same pattern appeared before the 2021 bull-run)
These are the classic signals.
Mainly three targets can be seen on the chart:
➖ 200% (short-term)
➖ 300% (short, mid-term)
➖ 650%+ (long-term)
While the chart shows a potential new All-Time High at 4,444 satoshis, the next peak can go even higher and hit as high as 7,777 sats. This is based on one of the systems that I use to project future potential targets.
That's all for this pair.
Enjoy your week.
Namaste.

$CTSI/#BTC [#Cartesi]: Resistance_BreakoutHey traders, Hey traders, Hey traders, we've identified a Resistance Breakout on the $CTSI / $BTC chart. The price has broken above a key resistance level, which can indicate a potential bullish trend. Taking in consideration the next resistance key levels are at 0.00000694 | 0.00000736 | 0.00000819 and the major support zones are respectively at 0.00000611 | 0.0000057 | 0.00000487. It is a bullish indication and we may consider entering at the current price zone at 0.00000689 and targetting higher levels.
Technical Metrics :
Current price: 0.00000689
24H Volume: 3.1871 Ƀ
24H Price change: 2.53%
- Pivot Points - Levels :
Resistance: 0.00000694 | 0.00000736 | 0.00000819
Support: 0.00000611 | 0.0000057 | 0.00000487
Indicators recommandation :
Oscillators: NEUTRAL
Moving Averages: STRONG_BUY
Technical Indicators Summary : BUY
- In-depth CTSIBTC technical analysis on > Tradingview TA page


Best Place to Buy CTSIIt is an awesome coin with a very bright future. The price is basically free right now. Do your own research and if you think it is a good investment, here is a great entry.

Cartesi22/1/22 First Crytro Investment, Writing to make description long engough. 21 and 50 day average

CTSI vs BTC : New ATH coming soonCTSI just repeating the past move.
Mainnet out very soon
Fondamentals are great
Team is amazing
This is a real gem.


ctsibtcCTSI BTC pair under huge triangle that I put an alarm when price catch that downtrend resistance that if break that level I will buy
BINANCE:CTSIBTC

CTSI/BTC DID 60% PROFIT AND STILL LOT MORE TO COME!Hello everyone, if you like the idea, do not forget to support with a like and follow.
First of all congratulations to everyone who took this trade. We are almost 60% in profit till now. I told you it will pump huge.
If you missed the last entry then wait for some time and buy it when the dip comes. You can buy it between 1400-1600 sats and hold it for huge gains.
If you like this idea then do support it with like and follow.
Also, share your views in the comments.
This isn't financial advice. DYOR before investing.
Thank You!

CTSI/BTC TRADE SETUP! 100-150% GAINS EXPECTED!Hello everyone, if you like the idea, do not forget to support with a like and follow.
Welcome to this Altcoin setup of CTSI. If you read my previous update on Bitcoin dominance then you know that dominance is continuously dropping from the resistance which is good for Altcoins especially BTC pair Alts. So my first pick for the upcoming Altseason is CTSI.
CTSI is forming a big ascending triangle in the daily time frame. However, it does not break out yet but when it breaks this triangle then we see a good pump. So buy now and accumulate more in dips.
Also, fundamentally it is very strong. There are some important events of CTSI at the end of this year that definitely push the price. So buy now and hold for maximum profit.
Entry range:- 1100-1250 sats
Target1:- 1472 sats
Target2:- 1840 sats
Target3:- 2380 sats
Target4:- 2868 sats
SL:- 952 sats
If you like this idea then do appreciate it with like and follow.
Also, share your views in the comment section.
This isn't financial advice. DYOR before investing.
Thank You!

CTSIBTCtest
Clinical Trials Intelligence (CTi) is a scalable blockchain platform built for clinical trials, to serve as a single source of truth for the clinical trial and pharma industry and designed for wide adoption by the stakeholders of the ecosystem
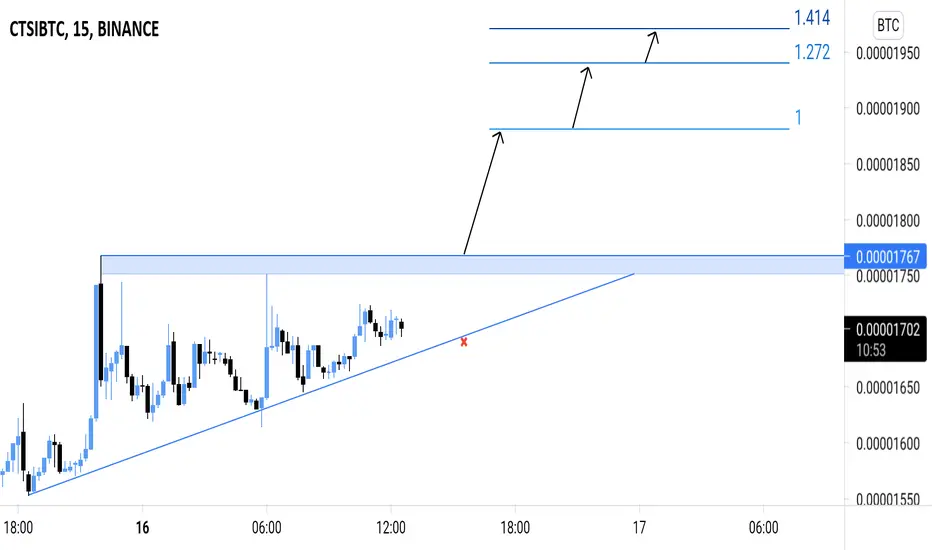
CTSI/BTC { CARTESI } - BULLISH SETUPANALYSIS 🔎
- CTSI/BTC is printing an ascending triangle pattern.
- This is a bullish build up pattern.
- There's a breakout potential.
BUY ENTRY ⬆️
- Market entry: current market price.
- Stop limit entry: breakout above the ascending triangle's horizontal resistance (@0.00001767)
- Limit entry: test of the ascending triangle's inclined support.
TARGETS 🎯
- Fibonacci extension levels.
SETUP INVALIDATION ❌
- Breakdown below the ascending triangle's inclined support.


CTSI/BTC parabolic curve?Solid fundamentals (dyor) with very active development. BTC dominance is very low at this time and if it stays sideways it would be very good for CTSI. I expect it to reach around 6000 sats before we'll see a correction. Not financial advice

CTSI: completed wave 5In MSAP model v2.4b, CTSIBTC made peak.
I don't think CTSI can reach higher level in CTSIBTC rate.

Looks like a patternOnly valid if dominance continues to fall, bitcoin stops dumping and CTSI stays above that line.


