6 RR Base Trade--long termIf Cortex holds the recent lows as previously, a larger bounce could occur, unfortunately this trade will take weeks to play out.
CTXCUSDT.P trade ideas

#CTXC/USDT#CTXC
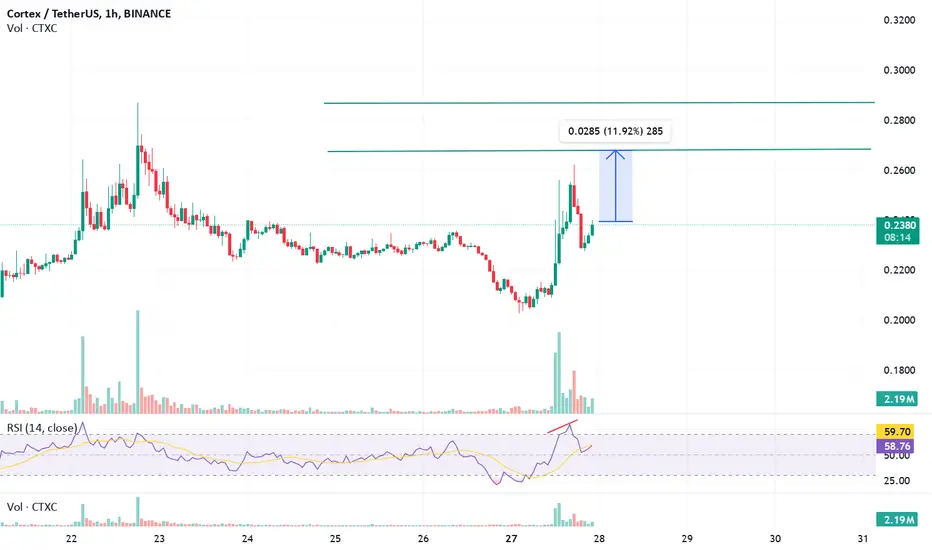
The price is moving in a descending channel on the 1-hour frame and is adhering to it well and is heading to break it strongly upwards and retest it
We have a bounce from the lower limit of the descending channel, this support is at a price of 0.1875
We have a downtrend on the RSI indicator that is about to be broken and retested, which supports the rise
We have a trend to stabilize above the Moving Average 100
Entry price 0.1900
First target 0.1987
Second target 0.2037
Third target 0.2112

Ctxc after punching resistance 0.185 .. 0.19Lets have close look at this chart!
In order to break down that reistance ,more power requared...after that the way is easy...
If the chart cant overcome the resistance and also BTC start correction ,that makes a huge affect on the Cortex chart price....
Lets push it upppp

Ctxc ....H1What you can see ...
Cortex would prove that is not a skam project ,it comes to crypto market for change ...

Ctxc falling channel breakoutCtxc breaked out falling trend to up,but investors are in doubt to buy! But whals (yellow bars) complete their investment and will start to push chart upp soon,maybe in a minutes by after...💯🌠🌒

Cortex heavy move After cortex afected by Bitcoin correction,it is Time to move against Btc even if the Btc be on corection side...
Lets push cortex up...
The faling trend breakout shows whals are working on it

CTXCUSDT(Cortex) Updated till 07-02-25CTXCUSDT(Cortex) Daily timeframe range. PA trying to hold on 0.1508. if it can than 0.2170 is not hard to visit. right now market is not in healthy mode either. so it can have effect. if 0.1508 fails it will get back to 0.1108.


A Plan BUY spot CTXCUSDT follow up trendStart a new week with Crypto
My plan for BUY spot this coin
Entry zone : 0.33xxx
Stoploss: 0.279
Target = 2R

CTXC Reversal just Confirmed after Bouncing From Demand ZoneCTXC Reversal just Confirmed after Bouncing From Demand Zone
Big Buy Opportunity still on table for the reversal pattern of CTXC after the big retracing from 1 $ Area

CTXCUSDT %3000 Volume Increase CTXCUSDT has shown an impressive 3000% increase in trading volume over the last week, signaling a massive opportunity.
However, the price is dropping rapidly, and buyers have not yet activated.
🔵 Key Zones: I've identified the blue boxes as critical demand areas where price could react.
⚠️ Strategy: Use these zones for potential entries, but only confirm them with upward breakouts on lower time frames.
📉 Risk Management: Stay cautious and keep your risk minimal, as the current downtrend may persist before buyers take control.
Patience is key evaluate carefully!
I keep my charts clean and simple because I believe clarity leads to better decisions.
My approach is built on years of experience and a solid track record. I don’t claim to know it all, but I’m confident in my ability to spot high-probability setups.
My Previous Analysis
🐶 DOGEUSDT.P: Next Move
🎨 RENDERUSDT.P: Opportunity of the Month
💎 ETHUSDT.P: Where to Retrace
🟢 BNBUSDT.P: Potential Surge
📊 BTC Dominance: Reaction Zone
🌊 WAVESUSDT.P: Demand Zone Potential
🟣 UNIUSDT.P: Long-Term Trade
🔵 XRPUSDT.P: Entry Zones
🔗 LINKUSDT.P: Follow The River
📈 BTCUSDT.P: Two Key Demand Zones
🟩 POLUSDT: Bullish Momentum
🌟 PENDLEUSDT.P: Where Opportunity Meets Precision
🔥 BTCUSDT.P: Liquidation of Highly Leveraged Longs
🌊 SOLUSDT.P: SOL's Dip - Your Opportunity
🐸 1000PEPEUSDT.P: Prime Bounce Zone Unlocked
🚀 ETHUSDT.P: Set to Explode - Don't Miss This Game Changer
🤖 IQUSDT: Smart Plan
⚡️ PONDUSDT: A Trade Not Taken Is Better Than a Losing One
💼 STMXUSDT: 2 Buying Areas
🐢 TURBOUSDT: Buy Zones and Buyer Presence
🌍 ICPUSDT.P: Massive Upside Potential | Check the Trade Update For Seeing Results

Ctxc now what ?
A reaction is expected within the area. It can break down and turn into IFVG, while an upward break may signal the beginning of the rise again. YTD.

CTXC Re-interpretationRecent strong sell-off is bearish IMO and prompted a re-assessment of the chart. Discounting the 2022 wick, this chart becomes a giant ABC on the way to zero. Wave 3 of 5 in the C wave of this pattern looks complete, so one more move up to go before getting out and never coming back if you are invested!

THE RETURN OF CTXC/USDTCTXC USDT seems to be an interesting view.
We will follow the data to see if it's able to show new targets.

CTXCUSDT on BinanceSee the weekly time frame All Time High will be 1.4000 Range can be hit today. it hit many a times on 1.0500 this resistance break will lead to 1.4000 or even above.

CTXC Cortex Update 2024-12-13Targets are Mentioned in the picture.
Note : This is a personal Idea an is NOT enough for trading.

CTXC Weekly Volume Spike +%800Volume Surge: Weekly trading volume has surged by 800%, highlighting significant interest in the pair.
Price Rejection: Despite a strong rejection, buyers remain active, suggesting potential accumulation.
Key Levels:
Buy Zones: Indicated by the blue box, representing areas where buyers are likely to step in.
Market Context: This analysis is tailored for spot trading strategies.
I keep my charts clean and simple because I believe clarity leads to better decisions.
My approach is built on years of experience and a solid track record. I don’t claim to know it all, but I’m confident in my ability to spot high-probability setups.
My Previous Analysis
🐶 DOGEUSDT.P: Next Move
🎨 RENDERUSDT.P: Opportunity of the Month
💎 ETHUSDT.P: Where to Retrace
🟢 BNBUSDT.P: Potential Surge
📊 BTC Dominance: Reaction Zone
🌊 WAVESUSDT.P: Demand Zone Potential
🟣 UNIUSDT.P: Long-Term Trade
🔵 XRPUSDT.P: Entry Zones
🔗 LINKUSDT.P: Follow The River
📈 BTCUSDT.P: Two Key Demand Zones
🟩 POLUSDT: Bullish Momentum
🌟 PENDLEUSDT: Where Opportunity Meets Precision
🔥 BTCUSDT.P: Liquidation of Highly Leveraged Longs
🌊 SOLUSDT.P: SOL's Dip - Your Opportunity
🐸 1000PEPEUSDT.P: Prime Bounce Zone Unlocked
🚀 ETHUSDT.P: Set to Explode - Don't Miss This Game Changer
🤖 IQUSDT: Smart Plan
⚡️ PONDUSDT: A Trade Not Taken Is Better Than a Losing One
💼 STMXUSDT: 2 Buying Areas
🐢 TURBOUSDT: Buy Zones and Buyer Presence

CTXC is now looking very bullish...Several AI charts are now starting to look like this, with an overlapping five wave move up (wave 1) followed by a rising ABC correction and now an impulsive wave 3 starting. They have all looked very bearing until now because the leading ABC looked like the B wave of a larger ABC and new lows were implied. This is clearly not going to happen. I urge you to look for other AI coins that have not yet broken out that have the same pattern. FET and MAN (Matrix AI) are two that I have seen; I will post their charts next...
The implied target for CTXC is $72; 100x from here

Analysis of $CTXC/USDT Analysis of $CTXC/USDT
Current Price: $0.4653.
0.618 Level: Around $0.4700, acting as short-term resistance.
0.786 Level: Around $0.3966, a potential retracement level if price declines.
Targets for Upside Movement :
$0.5203
$0.5746
$0.6346

Cortex Major Support Activated —Big Profits Potential RegardlessIt is interesting because even a minor jump can produce 260% profits. A mild wave can lead to 747% from the current price.
My fellow human being, follow me...
Simplicity as usual. We have so many choices to pick from when looking at these charts; so many ways to approach it, so many tools, so many patterns... But we like to keep it simple because we want the best results. Simple is best.
The black line on the chart marks the low price that was hit in July 2021, a "major low."
Each time this level is activated, as in challenged, CTXCUSDT goes bullish.
➖ Back in 2021, the activation of this level lead to a 1,167% bullish wave; Boom!
➖ In early 2023 another wave, around 400% (not shown).
➖ The level was activated again in late 2023 and by early 2024 we had a massive 820% total growth bullish wave. This leads to us to know!
👉 The same "major low" has been activated. A weak wave in late 2024 can lead to 260% - 340%. This would be a minor wave.
👉 A medium-sized wave can easy produce 747%; patience would be needed for this one.
👉 A major, full-blown bull-market wave in 2025 after this long-term support level has been activated can lead to a price tag of $3.66 which would be equal to ~1,800% growth.
It is interesting because even a minor jump can result in great profits.
Namaste.

Trade Signal for CTXCUSDT: Buy OpportunityDear Traders,
We have identified a potential buy opportunity for the CTXCUSDT trading pair using the EASY Quantum Ai strategy. Below are the details:
Direction: Buy
Enter Price: 0.1705
Take Profit: 0.1742
Stop Loss: 0.1644
Analysis and Justification:
Our recommendation is based on the latest market trends identified by the EASY Quantum Ai strategy. This strategy combines advanced data analytics with quantum computing principles to provide insights into market movements. Here are some key factors influencing our decision:
1. Market Momentum: The current uptrend in CTXCUSDT is supported by increased trading volumes and recent bullish signals observed through technical indicators.
2. Support Levels: The enter price at 0.1705 suggests a strong support level, minimizing downside risks and offering potential for upside gains.
3. Risk Management: With a carefully set stop loss at 0.1644, trader's exposure to risk is minimized. This ensures that any adverse movement is controlled.
Keep these factors in mind while you proceed with this trade. As always, stay informed of market changes and adjust your positions accordingly.
Happy Trading!

