Positive divergenceCVX is showing a significant trend alongside positive divergence. The price is currently moving above a strong trendline, which has been tested multiple times, indicating a robust support level. The positive divergence in the RSI suggests that the bearish momentum is weakening, and there is potential for upward movement.
CVXUSDT trade ideas

Short squeeze loading 2.0Spotted another candidate for a nice squeeze :) However, I am not as convinced as I was with TRB, because this is probably the worst shitcoin ever, I don't even know what it does but anyway, the setup is there.
Once BTC finds a bottom around 60-61k and goes up again, CVX could see a nice run, maybe 100%. BUT if BTC fails to hold 60k for whatever reason, I'm not giving this a high chance of squeezing, it could just break below current levels and drop another 90%.
Stay safe!

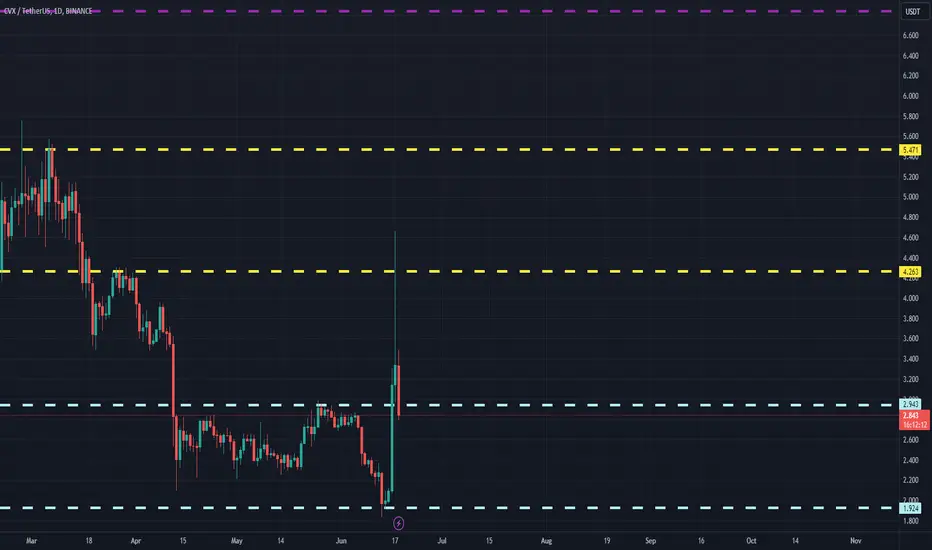
CVXUSDT(Convex Finance) Daily tf Range Updated till 18-06-24CVXUSDT(Convex Finance) Daily timeframe range. PA needs to stay above 2.943 or else it will fall back to 1.924. thats close to price discovery in reverse so thats a concern. if not dev or retail picks it up.

CVXUSDT - Short Squeeze Simmering? CVX Pummels Lower - Can Bulls Stage a Comeback?
Convex Finance's CVX token has been on a tear downwards recently, mirroring the broader crypto market weakness. The recent liquidation of CRV Finance CEO's holdings added fuel to the fire. But with short positions potentially piling up, could a short-term squeeze be brewing?
Price Action Clues for a Short Squeeze:
Sudden Spike in Volume: Look for a surge in trading volume alongside a price bounce off support. This could indicate short sellers scrambling to cover their positions.
Inverted Hammer/Hammer: These reversal candles with small bodies and long lower wicks forming at the support area suggest buying pressure countering the downtrend.
Bullish Engulfing Patterns: A two-candle pattern where the second candle engulfs the first candle's body and the previous day's high, signaling a potential reversal of bearish momentum.
Trading the Squeeze:
If you see these signs at the support zone, a short-term long trade could be considered. However, be cautious, as squeezes can be volatile and short-lived. Always prioritize risk management with a stop-loss below support and a defined take-profit target based on resistance levels or price channels.
Remember: This analysis is for educational purposes only. The crypto market is highly volatile, and short squeezes can be risky maneuvers. Conduct your own research and consider other factors before entering any trades.
#CVXUSDT #CVX #CryptoTrading #ShortSqueeze #Support #Reversal #InvertedHammer #Hammer #EngulfingBar #RiskManagement
Do you think a short squeeze is likely for CVX? Share your thoughts and price action observations in the comments!

Convex Finance CVX price surprises with growthWhile #CRV fell in price instantly -30-40% and liquidated everyone on its way.
The #Convex Finance #CVX DeFi protocol, which allows LSE:CRV liquidity providers to receive a share of trading commissions on the #Curve without staking liquidity there, made +150% "on easy"
This only shows how the market works and how capital flows: someone's loss in the market is someone's gain at the moment who chose the right direction (or created it :)
All we have to do is wait for the spot when our/your alts make a similar curtsy)

#CVX/USDT#CVX
The price is moving in a bearish channel on the 12-hour frame and is largely sticking to it
We have a green support area at 2.20 that is expected to be bounced from due to its strength
We have a trend to hold above the Moving Average 100, which is strong support for the rise
We have very strong oversold conditions on the RSI indicator to support the rise with a strong uptrend
Entry price 2.38
The first goal is 2.62
Second goal 2.82
Third goal 3.09

CVXUSDT Signaling LONGHey there traders
EnF Breakout Strategy signaled a BUY on CVXUSDT
See idea for breakout entry, targets and stoploss
Only enter the trade when the price break above entry
Check out more on the script:
To get access to this script, DM me

CVX/USDT descending channel expecting breakout? 👀🚀💎 Paradisers, pay attention: #CVXUSDT is navigating a descending channel and is on the brink of a potential breakout, indicating a strong possibility of an upward trajectory.
💎 Currently, #CVX is challenging the channel's resistance and has been trading within a consolidation zone. If it can maintain momentum at the key support level of $2.116 within this channel, we anticipate a substantial upward move, aiming for the resistance levels we've outlined.
💎 Given the market's inherent volatility, if NYSE:CVX fails to sustain its momentum and falls below the $2.116 support, it could signal a weakening of the bullish stance, potentially resulting in a considerable price drop.
MyCryptoParadise
iFeel the success🌴

CVXCVX looks interesting to LONG
Don't over leverage or better take on SPOT
SL is wide at 2.21
Targets are:
3.097
3.518
3.924
4.57
5.126
Why I am interested to long it:
Long consolidation
RSI came to its previous minimum on 3D
Bullish Divergrence on Smaller TF

#CVX/USDT#CVX
The price is moving in a downward channel on a 4-hour frame, about to break upward
We have an uptrend on the RSI indicator about to occur. Bounce up
We have a higher stability moving average of 100
Entry price is 4.16
The first goal is 4.30
The second goal is 4.60
The third goal is 4.95

CVXUSDT DailyHi
a strong move can be started very soon and 7$ will be a minimum target,
best regards

#CVX/USDT#CVX
The price has been moving in a perfect head and shoulders pattern since last May
We are now in the stage of forming the right shoulder of the model
Current price 3.58
First goal 4.125
Second goal 4.61
Third goal 5.063
Which represents 185% of the current price

🚀 CVX Rocket: A Journey into the Stars! 📈🚀🚀 CVX Rocket: A Journey into the Stars! 📈🚀
Hello Fellow Traders! 👋
CVX is on our radar, and it's poised for an exhilarating journey. Here's the scoop:
🎯 Targets in Red and White:
Zoom in on those red lines – they're your targets! But wait, there's more! The white trend lines unveil additional targets, offering a comprehensive roadmap.
🔄 Supply Check:
With a circulating supply of only 92,646,235 CVX, this crypto is in accumulation mode – a potential spark for exciting price movements.
💚 Prime Buy Opportunity:
Spot that green line? That's your golden buy opportunity! Keep some cash handy in case the market decides to dance to a different tune.
Top Trading Tips:
DCA (Dollar-Cost Averaging): The seasoned trader's secret weapon.
Diversify: Don't gamble your entire stash on one play.
🚨 Disclaimer:
This isn't financial advice. Success in crypto demands diligent research and strategic moves.
Wishing you the best of luck on this crypto adventure! 🌌💰


CVX USDT#CVX Price Update: After a successful breakout from a level marked, we will see massive gains. We could take entry after a 1-hour candle close above the marked level. Always use stop-loss. Everything is on the chart.
Entry 4.994
S.L 4.683
T.P1 5.193
T.P2 5.460
T.P3 5.675

#CVX/USDT#CVX
The price is moving in a descending channel on a 4-hour frame
Supported by the breakout of the Moving Average 100 and bullish momentum
It is expected that this descending channel will be broken upward
Current price 3.36
First goal 3.42
Second goal 3.56
Third HDQ 3.73
Fourth HDQ 3.88

CVXUSDT.PCVXUSDT.P is in bearish trend.
Potentially printing LH and LL.
Bearish divergence also shown in RSI.
We wait and watch for the breakout of last LL.

LONG #CVXUSDTLONG #CVXUSDT from $4.96 stop loss $4.75
15m TF. This instrument is in an upward movement structure, there are very strongly increased trading volumes as well as high activity from the buyer, we see that the price has formed the current local cascade on the lower TF above the previous long-broken consolidation, the price does not update the minimums + there is a good preload on the current ones, I expect to see a breakdown in the long marked cascade with growth potential to the $ 5.4 mark

CVX is a big bullCVX is very bullish in our view.
A large diametric is finished. CVX is expected to pump more soon.
Note that the wave that CVX is in now is very valuable.
We have a flip zone on the chart, as long as this zone is maintained, the targets specified on the chart are available.
Closing a daily candle below the flip zone will violate the analysis
For risk management, please don't forget stop loss and capital management
When we reach the first target, save some profit and then change the stop to entry
Comment if you have any questions
Thank You

#CVX/USDT#CVX
On a 4-hour frame, a perfect head and shoulders pattern
We are about to break the right shoulder higher
We have strong upward momentum that the price is expected to continue rising
Entry price 3.024
First goal 3.08
Second goal 3.188
Third goal 3.287

#CVX/USDT Long#CVX
The price is moving in a descending triangle on the 4-hour frame
We have oversold conditions on the MACD indicator
We have a downtrend, and by breaking it, we have a good rise
Current price 2.74
The first goal is 2.86
Second goal 3.04

CVX on the moveCVX is moving up with our buy prints and anything about our red line we can see fireworks as there is good volume our next expected target is 3.8 area and then 4.2 area. There is aslo a good volume generation. DyOR
