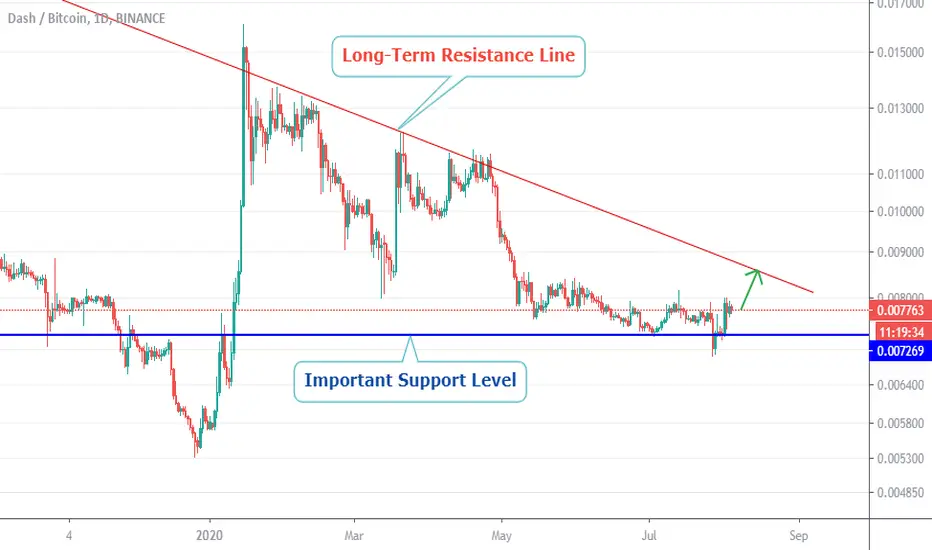
Bullish Accumulation on DASH on intraday.Hello, Traders.
We are forming a bullish accumulation after a reversal at an important support level. The target is the long-term resistance line.
Best regards.
Sandro and Gustavo.
DASHBTC trade ideas
DASH/BTC - WOWDASH is looking exactly like VET before it broke out!
- Even against ETH it's looking great!

DASHBTC AnalysisAs of now, I'm bullish since there are two BUY signals from EngineeringRobo & if the candles will break the down trend line, I'm expecting the candles will reach to 0.027BTC resistance level.
For now, watch for the candles and if it breaks the down trend line, I will be super BULLISH!
262.43% mid to long term target.

DASHBTC Broken long term triangle resistance. Expeciting AB=CDDashBTC completed its ADCDE trianlge correctiong and broken out of triangle.
Only issue is Volume, Entry upon volume confirmation.
Targeting Preivous highs which will also be completion of ABCD pattern,
THe chart looks fantastice to show growth. Just keep an eye on volume
thanks
Please like and subscribe thanks

DASH / BTC - an expected breakthrough but to where?I've been monitoring Dash the past weeks and I see a huge potential, especially as it seems a bit left off from the rest of the alt rally that we have been witnessing.
The diagram shows a very weird progression since the last impulse and I've been pondering where the fuck to place the abc correction so there are 2 possibilities in the short term:
1. Either we have set the C wave and we should expect an upwards impulse or
2. We are in the C wave now and after it finishes above the start of A wave, we would have a down impulse to set the bigger C wave from where we should shoot up.
So either way, I had entered previously at about 75k btc and will ride to the circled zone from where we should scrutinize the price action and determine whether we continue up or go down to complete C wave.
External factors:
BTC/ SPX correlation seems to have cooled off and BTC is a big boy again doing its own thing but still - I am short Nasdaq for a while which means that the overall market may tank, if it takes BTC with it, confidence in alts could go away and we will go in the red. So keep it a quick trade with a bit more looking after the position.

$DASHBTC moon incoming Another beautiful looking alt out there with 2X potential. $DASHBTC is holding its range low excluding what I deem to be deviation from the range low. This is looking solid and I'm picking up a bag here.


Time to buy ... can make profit first 30% to 45% .all coin go up now this time to DASH go up .. good support time to go up


DASH-BTCGreetings,
DASH coin in the low global trend, the daily chart shows the channel. The secondary trend is also downward, in the form of a wedge.Now the price has approached the trend, as well as to the zone 8000, which is a strong level and the last one was from it. After the previous pumping at the beginning of the year, the price corrected to 0.786 Fibonacci. After the break-down I expect a strong movement, the first target is 20-25% in the 10000 zone. Further targets for the volume indicator are on the chart.
If the idea turned out to be useful for you, support it with likes. I also remind you that I have a telegram channel, the link to which can be found in my profile, where I place ideas more often, and intraday trades.

$dash some thoughts on what can happendefi is the narrative now, just like lots of narratives before. Have exposure to it while its all going up... that said....
going through the charts i see stuff like dash. I think on a move past 0082 we go to .0107 or so
going higher and taking out the .012 i see near .03. Why? Whats the narrative? I dunno, lets find out then.
its a down trend for now with a possible higher low forming / formed.


WILL DASH EXPLODE!?DASH/BTC IS ON THE VERGE OF A BREAKOUT!
Dash is ready to make its move, but will you be part of it?
For the past few months DASH has been in a downtrend within this falling wedge, but finally there are some signs of strength.
MACD > Bullish
Volume > Increasing

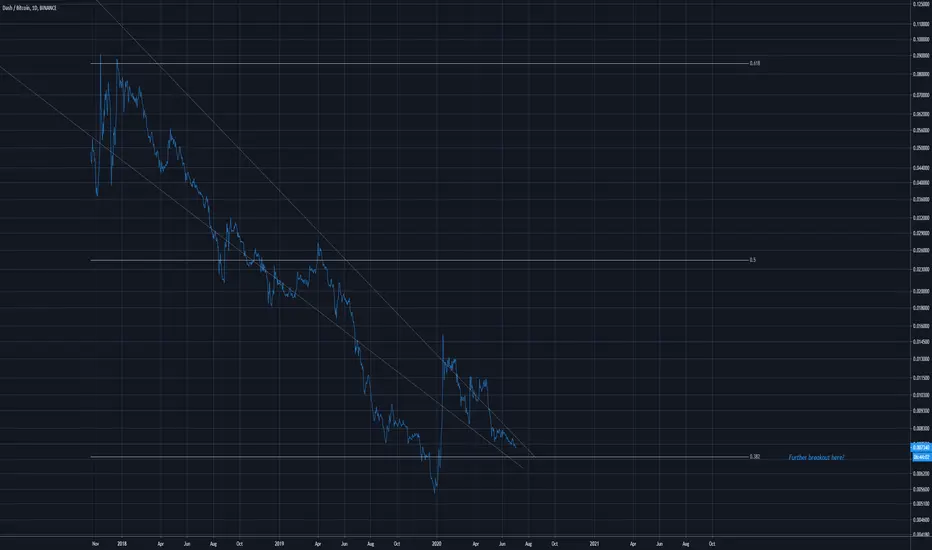
DASH Falling WedgeDASH Idea
Possible sup at 0.382
A strong bounce off 0.382 has already been seen, it may continue
Volume is also very large.