DASH - Accumulation phaseHere's another good R/R alt. Use a SL a few % below support, enter on the reversal. The chart will be very clear by then. Easy Peasy.
DASHBTC trade ideas

DASH reversal?DASHBTC showing bullish divergence in daily MACD while price is looking to approach bottom of a falling wedge formation. DASHUSD RSI approaching the same point. Were these big dumps on Polo some attempts to shake out stop losses into stronger hands before a reversal?


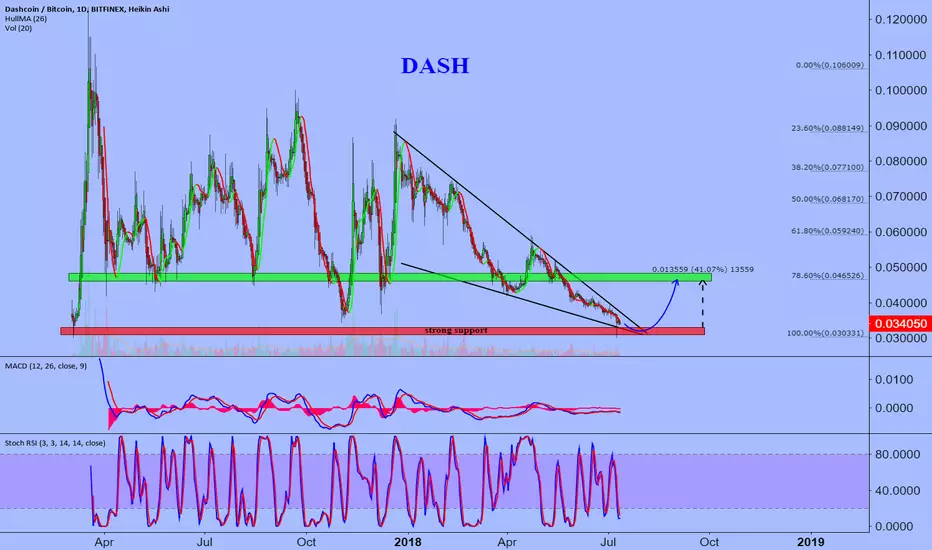
DSHBTCThe asset is in a large downward wedge, near the strong support zone the output from which will allow to test the resistance levels at the levels 0.047
My view how Dash gonna look in the 2019-2020 I want to share my view on Dash in the future i think it should look something like this :P

#Dash trying to break above #Dashbtc #crypto#Dash is trying to break above the falling wedge that is inside a downtrend channel.
Entry on a pullback if the downtrend resistance of the channel is broken with conviction.
Also, Dash seems to have completed a WXYZ correction with the Z wave at 0.886fib of W
50DMA is 0.039
Target 1 around 0.382fib level and 100DMA resistance: 0.043-0.045
Target 2 around 0.618fib and 200DMA resistance: 0.050-0.053
Stop below Support zone: 0.033

Dash party ?! Dash is going undercover for months now ... A true gem that deserves to be in top 10
Safe entry after breakout
The breakout should be massive ... Let's wait and see

DASHBTC - DASHUSD - Do or Die - Long IdeaWe are at critical support here. We've already seen a capitulation candle down, and this is a safe area to start going long. Keep in mind though if we break this level you MUST have stop losses as the next levels are around 0.02

DASH 7/10
Broke through supports strongly
Approaching a former support, if it breaks through it may get back into that initial consolidation zone

Potential bullish signal in DashThe #Dash has broken out of the wedge yesterday, adding to the overall bearishness of the coin. The coin broke the wedge to the downside and then closed significantly below it. However, the #Dash stopped at 0.03430 level, that represents a significant support level that provided support to the coin in its recent history as well. Now that we trade outside of the wedge, we should have a more clear picture on what is ahead of us.
On the 4H chart, the #Dash created a bullish engulfing candlestick pattern. In general, this pattern suggests the bulls have taken control of the price action movement from the bears. This type of pattern usually accompanies a declining trend, suggesting a low or a short-term end has occurred.
So, the break out of the wedge is bearish but the engulfing candle has provided some light at the end of the tunnel for the bulls. Hence, we believe that given the recent bearishness in the coin, we are leaning towards a bounce in the Dash, especially as the coin has reacted really well from the horizontal support. The RSI is also pointing towards a bounce. An additional bonus is the fact that we are sitting at the support, hence the R:R in the long trade at these levels is very good.
LONG
Entry : Current market price - 0.034540
Stop : 0.033200
Target 1: 0.036200
Target 2: 0.038000
Target 3: 0.039700


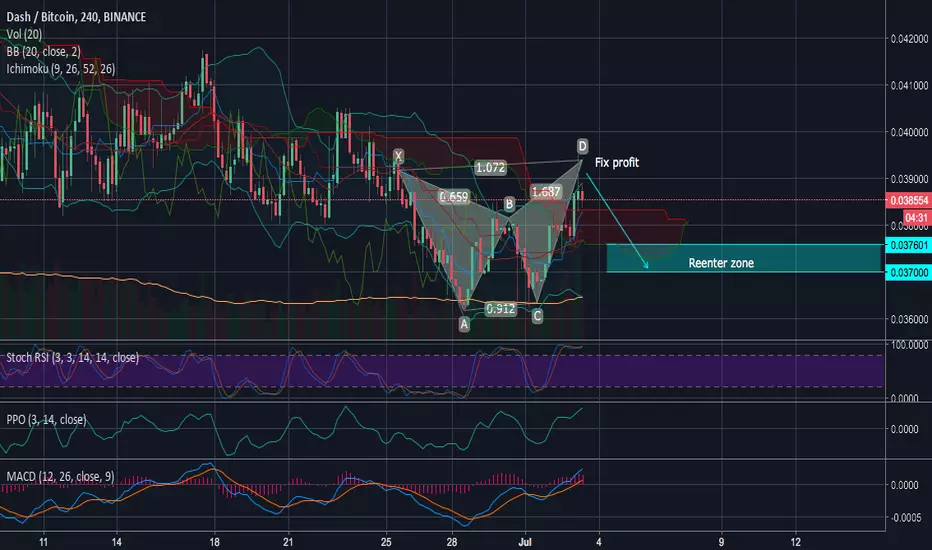
DASHBTC updateWe gave the signal for DASH on 24th of June. Please fix the profit and wait till it consolidates as XABCD was formed and the price is in Overbought state. A small correction should start before the further growth to our targets. You should reenter when the price will be in the specified area and follow the targets in the signal
DASH/BTCThere's always going to be another long or short entry..
No need to ride every wave or chase every profit.
The thing that used to keep me in the losing bracket, was my inability to stop chasing my own tail.
Be patient. Be meticulous. Trade with conviction.

Dash Elliott's Wave [Falling Wedge]As we did see this week, things seems to be back again and is the overall crypto market is showing a good motivation. As the market downward movement in general, which mainly occurred because of Bitcoins price rally failure, affected almost all alternate currencies Dash was also affected. Market is showing a good progress and here Dash also faces a falling wedge which seems to break at anytime soon. Next major resistance line is at the 23.6% fib level around 0.0414 Btc.
RSI is showing a good angular movement.
Volume is just needed to see a spike and a breakout.
Possible Targets / Fib Levels
Target 1 : 0.041485 BTC
Target 2 : 0.044866 BTC
Target 3 : 0.047599 BTC
Target 4 : 0.050332 BTC
Longer Term Targets / Fib Levels
Target 5 : 0.054223 BTC
Target 6 : 0.059180 BTC
Good Luck.
Legal disclaimer:
Information on this channel is our team's analyst's "opinion" based on data available at this point in time. These opinions are not recommendations to buy or sell securities/commodities and cryptocurrencies. Trading and investing is a risk and you should not rely on this data to make any financial decisions. You must consult a financial advisory licensed by regulatory agencies in
your legal jurisdiction. All information stated here and in our reports don't gurantee any possible profits or losses. Please do consider to do your own due diligence and research when making any kind of a transaction with financial implications. With Regards. TeamTWA.


#DASH #BITCOIN #BITCOINPRICE #TRADING #BITDHARMAWell, price has being following the channel for a long time. Right now we can expect that trend will be bearish because price is breaking de channel.


DASHMoving in triangle. Waiting for break out. Looking for two next fibonacci levels
Great news
Evolution v1 - Mainnet (June 2018)

$DASH #DASH - LAST HOPE - Break downtrend now, or BYEHello Lads and Ladies,
Today we are going to take a look at DASHBTC. Currently the 13th biggest crypto by Market Cap. It has been in a humungous downtrend and the question is when will it finally leave this downtrend and where can we expect DASHBTC heading to?!
Starting off with the huge downtrend line (indicated light blue in the chart), which originates at the 20th of December last year. DASHBTC never really left this downtrend now for almost 6 months, it has tried to do so and failed multiple times with that, what can be pretty depressing. Nevertheless, it seems to be coming to and end of this tremendous downtrend and gives quite a bit of room to play with.
It is important to mention that DASHBTC was holding itself above 0.06 BTC for quite a long time and has confirmed this line multiple times again as a historic support and resistance line (indicated red in the chart). I chose the red color, because it has been broken and acts now as a strong resistance and a potential decision point after a big push.
The next support we are taking a look at is located at 0.043 BTC (indicated orange in the chart), this line has been historically a intermediate support and support resistance line, where the chart makes a small stop, when making big moves. Although, it has been a pretty strong support in the timeframe of 30.03 - 16.04, this was a phase where nothing special happened to DASHBTC and it got ready for a pump, which was heading towards the downtrend line, actually broke it for a day and tested the 0.06 BTC resistance. The very important aspect was here that it just had picked up enough momentum and volume to break through the downtrend line, and then it was supposed to break a HUGE resistance right away, of course it got rejected there because there was not enough momentum and volume left. This had a steep retracement with it, nevertheless, it was hugging the downtrend for almost a month, leaving it for a day but coming back again and retracting more from the downtrend. It had a small stop at the intermediate support line (orange) and continued from there, as already explained this support line is able a stronger momentum.
Eventually, it tried to break the intermediate support and resistance, failed to do so twice and continued its journey to the next support at 0.039 BTC (indicated green-dotted in the chart). From there on it was moving sideways and approaching the downtrend, trying to push through it multiple times right now in a very short period of time. Also sitting on support during the whole time.
Based on that there are basically two options left.
The 1ST one would be that DASHBTC breaks the downtrend very soon and pushes towards the intermediate support/resistance deciding there, whether it uses it as a new support for a short time and continues the push towards 0.06 BTC OR it gets rejected there and comes back to the support it sitting at right now.
The 2ND option is that it breaks the current support, gets wrecked and retraces even further down to the next and the last-hope-support at 0.0338 BTC. From there on it would most likely have really a lot of volume and buyers to let it bounce hard and break the downtrend with a very high chance.
Cheers, Tomas

