DASHBTC Appears to be retesting the neckline of an inverse H&SDash has been one of my favorite projects for a while. Right now it appears to be in a multi month long rising wedge that I suspect will break to the upside. But first it has to get off the wedge support and it appears to be doing such with an inverse head and shoulders centered at the 0.0050 level.
The support of the wedge is in part defined by the head and right shoulder. I expect that once this retest is done we will see a quick move to the 1.618 fib level of the hight of the head, but from there the main thing to observe will be the splitter on the wedge. For price action to behave more bullishly it will have to stay in the upper half of the wedge.
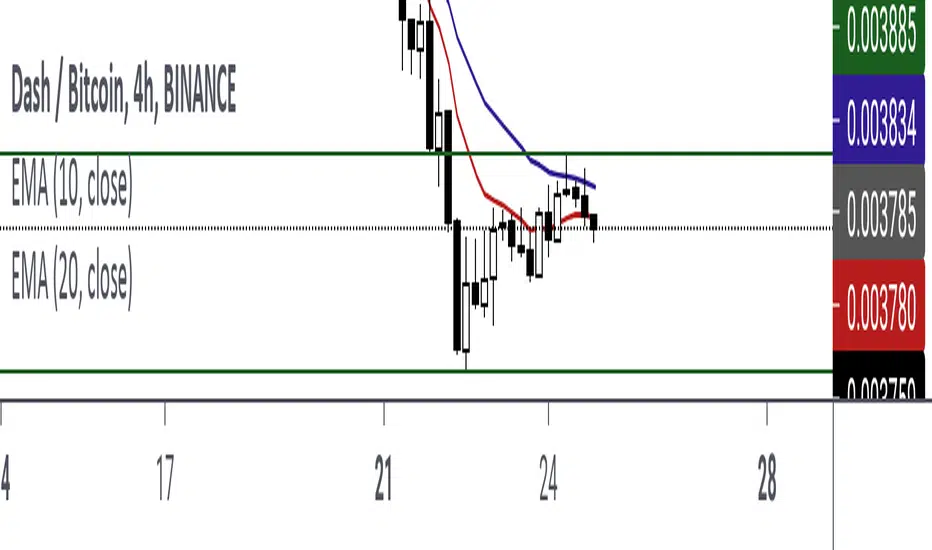
On the 4 hour chart it seems our situation in the purple circles resembles the black circles.
I entered my position on DASHUSD when DASHBTC was on the upward slope of the right shoulder and have a stop loss below the valley of the right shoulder. I want to let this ride a bit more before I move my stop to break even or slight profit. From my entry I hope to be patent and wait for it to pop out of the wedge.
If I see DASHBTC start to make a bull trap like it did against the purple line below that will be a sign for me to close my dashusd trade. Right now things are going smoothly with the initial ascent shown by the blue trendline. As of right now there isn't even the price action to draw a new purple line for that phase of the uptrend.
As you can see, DASHUSD also appears to be in a inverse head and shoulders and price action appears to be testing the neckline on that as well.
A zoom in:
I hope to take some profit of my margin trades at major fib levels and use some surplus on dip buying. A zoom out of dashusd
And just for giggles, here is DASHETH with what appears to be a falling wedge on a flag pole. Lots of volatility all over the place.
DASHBTC trade ideas

DASHBTC is creating a descending channel 🦐DASHBTC is creating a descending channel below the weekly resistance after the breakout from the dynamic trendline.
We need to monitor two levels
1) the W's neckline
2) the breakout from the weekly resistance.
According to Plancton's strategy (check our Academy ), we can set a nice order
–––––
Follow the Shrimp 🦐
Keep in mind.
🟣 Purple structure -> Monthly structure.
🔴 Red structure -> Weekly structure.
🔵 Blue structure -> Daily structure.
🟡 Yellow structure -> 4h structure.
⚫️ Black structure -> <4h structure.

Comparing DASHBTC to ETHBTC for a DashUsd battleplanIntroduction
I have been a fan of the market structure on DASHUSD for a while now and I think it is poised to surprise a lot of people considering its fall in rankings on CoinmarketCap from the last bull market highs. In order to help me figure out where I should be exiting my DASHUSD/T trades I am going to be using the similarities I perceive in the DASHBTC chart when compared with the ETHBTC chart as they both seem very similar to me.
Key point is both charts have a lot of history that permit long term charting. A lot of the new up and coming coins don't have the amount of historical data and so it is harder to look for these relationships. Having the history permits me to have more confidence in where I want to take profit which is very useful as I don't want to be re-upping and re-longing my equity to close to the top. Very expensive mistake.
Analysis of Similarities
Orange Zone Bear Market : as an area of consolidation for both trading pairs. The bottom of the zone acted primarily as support for DASHBTC in 2016 whereas it acted as resistance for ETHBTC. Conversely, the top of the zone acted as resistance for DASHBTC but once ETHBTC got above the zone it acted primarily as support. It was such good support that when ETHBTC dipped into the zone in late 2017 it set of a massive rally straight to the grey zone, which defined the bull trap for ETHBTC. That was a an over 400% move on the pair and coincides with ETHUSD going to its previous bull market all time high.
Orange Zone Bull Market : ETHBTC has already completed its bear market and we see a massive and beautiful inverse head and shoulders that formed with the shoulders mostly within the orange zone and the head below the zone. ETHBTC had an abortive attempt to have the right shoulder perform around early February and price action stalled at the black trend line. The chart below shows about where I suspect Dash will be during that stall, and I do like that price target.
Red Zone Bear Market : The red zone is where, quite frankly, price action fell off the cliff in Februarys of 2017. This is where the 13 and the 48 weekly EMAs crossed bearishly. Those time settings may seem odd, but a lot of research when into their use and can be read here: www.benzinga.com
Red Zone Bull Market : ETHBTC stalled right here while BTCUSD and ETHUSD set all time highs. I would be quite happy to see DASHBTC stall in its redzone while DASHUSD sets an all time high. As my chart above shows, that will be around $4,500. It also seems that ETHBTC is forming a bull pennant right under the red zone and I suspect we will see it charge quick quickly to the gray zone.
Grey Zone Bear Market : The gray zone is the body of the weekly candle at the BTC pair all time high. I suspect that may be a very likely place for price action to stall. We can't tell just yet what will happen because we don't have a lot of historical data. I am just emotionally preparing myself for a drastic stall but obviously what is happing on the USD pairs will be important, as well as what is happening in the traditional markets. We are still waiting to see how the gray zones will play out in the bull market.
DASHUSD and my trades
Hopefully this chart shows well enough my thinking on DASHUSD. I entered a x3 and a 10x trade on DASH last week and I will be using my x3 gains to keep my x10 trade alive if needed to have it reach its target on the DASHBTC chart. I have seen the structure needed for me to double up my x3 trade and feed my 10x trade a little bit.
I suspect DASHUSD might go sideways for 2-4 days until it finds support on the top of the channel that it used to consolidate from the upwards break of the rising wedge. If so I may add to my position.
Conclusion
THe main reason I battle plan is to settle any euphoria I may be feeling when a big move works in my favor. Things are looking good for the broader crypto market and I suspect that this bull market is going to last longer than a couple of months like some people are predicting. Prior to July monthly chart close I was quite bearish but BTCUSD and ETHUSD did what they had to do the last week of the month to show the trend was reversing. It seems that was basically our first sell off, or the 2 wave of an Elliot wave structure so I think we have quite a long way to go, timewise.
I am personally done watching BTCUSD as my crpyo bellwether. It's chart was significantly more bearish than ETHUSD based on chart patterns and a host of other indicators. I basically see ETHUSD currently similarly poised to its location in early 2017. Which means I think we are going to have a banger of a Elliot 3 wave a horrific 4 wave and a 5 wave for all the jonnie-come-latelies. Here is rough estimation of what I think the next year holds for ETH and therefor the broader crypto market. And of course, all the normal disclaimers apply. I am not a financial adviser or a CMT.


DASHBTCDASH BTC looks price near to end of the correction .
price is in near to end of the long term down trend.
the arrow show estimate time that need to grow.
use sl in every trade

DASHBTC LONG SETUPDASHBTC on the daily timeframe since the price's recent bullish impulse, market has provided us with a correction to the 0.618 fibonacci and formed a new higher low, now we are expecting the continuation to the upside. On the 4hr timeframe we are waiting for a 4hr close above this level of resistance then IF we see a 4hr close above this zone on the retest we will enter a nice long.


DASHBTC is testing the daily support 🦐DASHBTC is testing the daily support after an important bearish impulse. IF the price will lose the support, we can see another bearish impulse.
According to Plancton's strategy (check our Academy), we can set a nice order
–––––
Follow the Shrimp 🦐
Keep in mind.
🟣 Purple structure -> Monthly structure.
🔴 Red structure -> Weekly structure.
🔵 Blue structure -> Daily structure.
🟡 Yellow structure -> 4h structure.
⚫️ Black structure -> <4h structure.
Here is the Plancton0618 technical analysis, please comment below if you have any question.
The ENTRY in the market will be taken only if the condition of the Plancton0618 strategy will trigger.


Similarities between DASHBTC and ETHBTCI have had a favorable view of Dash for a while and have been trying to construct a trading plan. The scratching in the back of my head had me look at the DASHBTC chart and compare it to the ETHBTC chart and here are the similarities I plan on using until my plan is invalidated for the next couple of years.
Chart Overview and Analysis
The black bands were drawn on the monthly chart and are zone of serious consolidation for many years for both trading pairs. When price finally clears the area on the monthly timeframe there massive gains to be had. The top of the zone failed as support there was a multi-year bear market against bitcoin
Ethereum moved faster against bitcoin but it also had less upside and downside. Dash is taking longer to consolidate against Bitcoin but when it finishes it very likely will have more gains for the patient.
The speed of the movements can be seen with ETH already way above its 400w EMA and finding resistance and consolidating against zone of price action where it failed to find the 400 as support.
Dash has a chart pattern against the 400 EMA just as ETH and I suspect it will resolve bullishly. This will take price action above the 400 EMA and to the resistance trendline which is now some 7 months old. From there a retest of the 400 EMA/Megaphone support would be very natural.
DASHBTC retesting the 400 EMA is a very serious even. It could be over a 50% pullback on the pair and an even more serious pull back against USD, up to 70 percent. DASHBTC could resolve itself bullishly while DASHUSD and BTCUSD are in a multi-year bear market.
More Charts
Below is the Fib Retrace from DashUSD ATH to bear market low and we see that price action failed right in the golden pocket. I suspect we will see a lot of consolidation and the next major stall will be at the 0.786 and then price action will test the 0.618 as rough support.
The next chart is the most provisional but it shows a possible recovery route for Dashusd. There was a quick move to just shy of the 0.5 retracement level, a consolidation and then a move to the the golden pocket. I expect something similar but not an exact repeat.
Here is a zoom in of DASHBTC on the daily chart. The MACD Histogram has a lot of bullish divergence as does the MACD (Asprey Version) and the RSI has found a technical double bottom. I suspect price action will stall at the top of daily BB and Keltner Channel and have some chop but the price action in February does show I could be pleasantly surprised by a very quick move to resistance.
DashEth on the weekly is looking like it will return to the black trendline and possibly beat it as resistance. The purple arrows show bullish divergence and the orange line shows a technical double bottom. Very promising and even if it stalls at the black trendline again it still doubles against ETH.
Final DashUSD targets
Here is Dash next to ETH on the long term chart. Both have the ichimoku clouds on the weekly setting turned bullish and it makes it clear that in very short order DASH could be closing in on its 1.414 fib extension over $8,200 or perhaps an even higher fib target. Off to the left we see the importance of taking profit before the major levels as ETH came to less than 10% of the 1.414 level. But if Dash is anywhere near close to target in a year or so I will be a very happy man.
One reason why I do like fib channels is it called the Eth high perfectly. I might have to settle for mere 5k Dash before a major consolidation. A mere 30x from here.
Closing Thoughts
This charting reflects a lot of my trading style and personality. I am sure they new coins out there that may have more upside than Dash and that are moving a lot faster but as I get further along in my trading and active investing I want something with more history against both itself and major alts. All the general disclaimers of this not being trading advice and myself not being a advisor apply.


DASHBTC closer to the uptrend support lineDASHBTC was unable to pass0.0055 level for further upside attack and started to drop with btc dominance. Last defend line is trend support point which is sitting around 0.00455-0.00460. we will see if it will bounce from there or brake the uptrend and will turn back to the all time low target ( 0.0023x ). Apart from the market dash is drawing so negative charts as USDT BTC ETH and BNB pair


DASHBTC targets after accumulation timeDASHBTC broked longtime down trendline and after huge sell of on btc again dropped back to the early points. Now the target is 0.00580 - 0.00650 - 0.00770. When BTC start to climb over 43k fast recovery expecting from DASHBTC.


DASHBTC Technical AnalysisEither at breakout the Resistance or at pullback at 0,00474 will go up to 0.005409
SL @ 0.0044
TP1 @ 0.005409
TP2 @ 0.00635
