$DASH Great news before pump, catalyst for recovery. $DASHBTCThe DASH marketing team is among the best in crypto, if not the best. There was also a conference mere weeks before the BTC pump which overshadowed DASH. You can see the extended downtrend at the bottom of the bollinger band and below the ichimoku cloud. The MAs have finished reversing as of the last bollinger band squeeze, right in time for a recovery, I would expect a push through the red ichimoku cloud soon, it bounced off of it and will retest it, turning its resistance to support, see the square where it's also pushing the fibonacci resistance.
DASHBTC trade ideas

DASHBTC Bullish ContinuationView chart for details.
Support / Resistance : Black Lines.
Low Risk: High Reward


DASHBTC - Important SupportPay attention on this level. It is a very strong support nevertheless all cryptocurrency are going downwards due to the strong momentum of BTC,

DASHBTC Possible reversal @ 0.024I am seeing DASHBTC dropping to 0.04, then 0.035 and finally a reversal at 0.024.

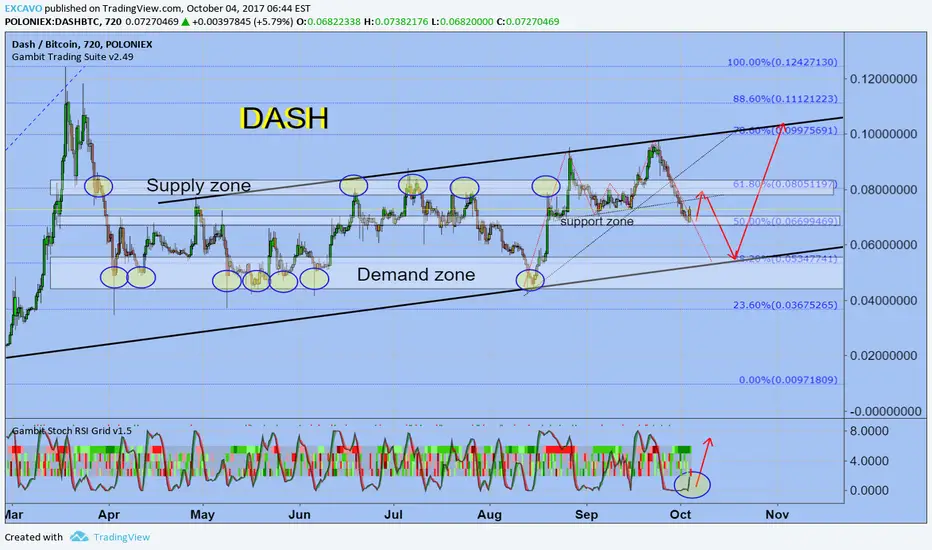
Gonna bounce again on support ?Looks like Dash is gonna bounce again on support, but think it need more volume for another breakout to happen

$DASHBTC Testing... supportI'm seeing a solid support for Dash I will look place my BUY near 0.048 DASH
BUY ORDER .048
starting
support
Uptrend Cycle
jds

DASH LONG TERM SHORTLooks like the price is not going to break the top in this wave, and this pattern looks like a big complex correction pattern and it is breaking down.
if we get a downtrend impulse this time, i think that prices will break 0.03 level to go lower.
Buy again at 0.02-0.01, if there i will see a new accumulation pattern
Always trade with care and have fun!
risk only 1% of your capital
money managment will save your life
Happy trading to everyone

Dash Coin 126 % profitDash coin can give good profit. Stochastic and RSI in oversoldness . DASH touched trend line so next move can be volatile with high volume. But if it break trend line price will fall to demand zone
Good luck.

DSHBTC reversing to trend upwards1-day TD sequential got to 8 sell and currently a 1 buy (candle not yet closed)
Supported on channel bottom.
4H chart shows bullish divergences on MACD, RSI & EFI
Volume shows accumulation.
I am long.


Big potential for DashBig Support has been hit and pushing back the value right now,
also it is coming with the support level of fibo
adding good signal from RSI
40% in few days


DASHBTC short term going UPI see the opportunity to BUY DASHBTC
it is going up in short term
for someone who like to intraday trading
this pair is for you
i think it is having a big chance to move up to target price 0.073
If you like my analysis and signal
please help to like and follow
Thank you

DASHBTC, DASHXBTAfter longer than a week bear, DASH has chances to recover based on the TD sequential


Dash/Btc potential Head and Shoulder Pattern formingDash/Btc is forming a potential head and shoulders pattern on the 4hr chart.
Rsi is heavily oversold and Macd is crossing which confirms a reversal to form the right shoulder.
Keep an eye on the daily chart before entering the market there is room for more down although the 0.50 fibinacci level is a strong support.
On the chart you find my buyzone, price target is located at the right shoulder. If it breaks the buyzone support is located at the 61.8 Fibonacci level.
