Strength in backgroundSOS in background potential movement to the upside while price remains above trigger levels.
DASHBTC trade ideas


Recent Strength more uprecent SOS potential more up movement. target price levels marked at top on chart. price action must be above trigger levels.

DASH BTC Upward trend.Dash looks primed to blow one last time, recent retraction indicates buy signal at fib resistance line. Chart generated using fib circles projecting out based on a shorter 5th wave up to .12 BTC.

Long position. Target 0.0910The price has naturally bounced off the Bollinger Bands range border. However, its return to the center is not likely to happen. The range is widening which signals of a strong trend. The price will probably bounce off the support level and will repeat its high at 0.0910.

Dash analisys based on EW.Becasue smaller 1-5 had 0.38 correction, bigger impulse wave is likely to have same level of correction too.
After that - 3rd impulse wave - up.

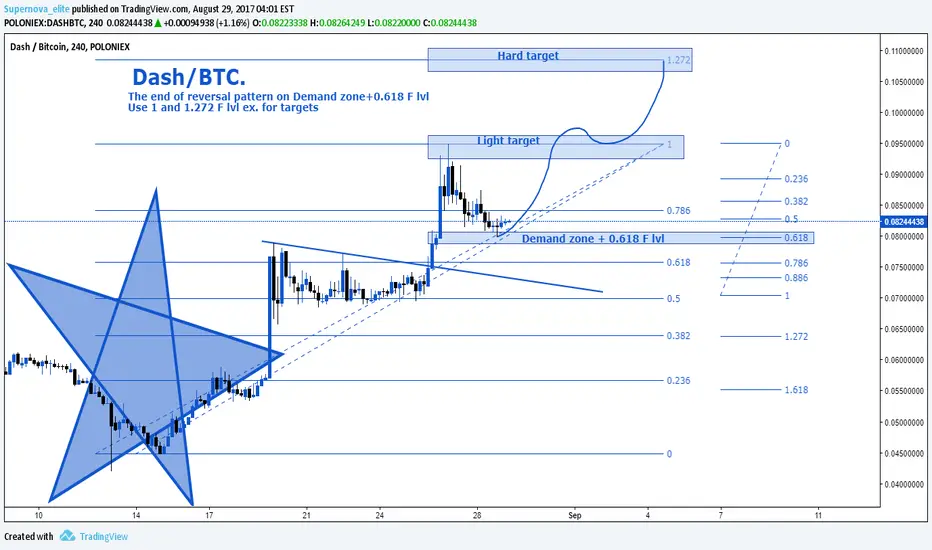
Dash/BTC.The end of reversal pattern on Demand zone+0.618 F lvl
Use 1 and 1.272 F lvl ex. for targets
Third impulseDASH just bounced of some longer term support and broke out of a bullish wedge. According to Elliot Wave Theory a third impulse is due.
This somewhat relies on BTCUSD not making a new ATH in the next days, because if BTC rallies altcoins usually goes sideways.

DASHBTC buyMany reason to buy DASHBTC
1. channeling up
2. 4h chart is above ichimoku cloud
3. current price at kijun-sen line (ichimoku cloud)
Best price to buy at 0,080

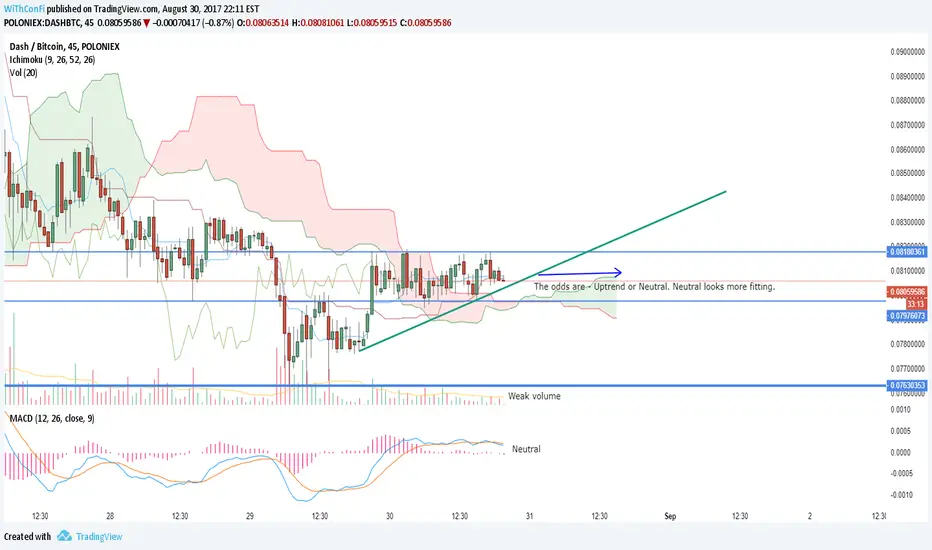
$DASH $BTC Just follow the rulesDash smoothly in patterns moving beautiful upright movement and neat correction state now on support but could drop slightly my expectation is that this will take some time to dance between 61.8% 50% 32.8% before we go further up looking for a low point and get in

weakness in background confirmedSOW in background with change in behavior and price action bellow trigger price level. waiting for lower TF SOW confirmation.

DASHBTC Watch for Eliot Wave Formation.With the move of the first wave we see a decrease in volume. the indicator MACD showing oversold and the candles coming down to the Bollinger Bands Moving Average. I would expect the carts to trend down and then we should have a point of hope at A, Point of reality at B and a possible retrace to C, for a consolidation. Consolidation expected at support level of 50.0 Fibonacci line. Thanks for reading hoping to see your comments and thoughts in the comments.

Weakness in backgroundSOW hitted at high of recent up movement. waiting for price action bellow trigger level (yellow line) , alignment of MTF (15-30-45 at least) and retest of area whith SOW confirmation.


