Dash, Uptrend for the Long Term.Hello Traders,
Dash is crossing a very impórtante downtrend line. If it confirmes in the weekly chart the breakout, it is expected that this coin will give us excellent trade opportunities in the future. So I recommend to pau attention to the coin.
Please push the like button and follow us on Tradingview.
DASHBTC trade ideas


Quickpost: DashBtc looks great on the monthly chartDash continues to show strength against the dollar and against bitcoin and so it becomes just a matter of time before lift off.
The bollinger bands show where we may get some stalling as Dash moves up. Resistance at the baseline is to be expected, and likewise it will take a long term continuation pattern to get us through the bollinger band and to the blow off top that will signal the end of Dash's season.
The RSI has shown a technical double bottom. In our current instance with a lower low on the price action could be considered some subtle bullish divergence. If we do assume a double bottom then we are looking for the RSI to move upward, and that means Dash has to go upward.
The price action has given us a lower low since December 2019 but both the Stochastic and the Stocastic RSI are showing higher lows. This suggest Dash will get some movement to the upside against bitcoin in the next couple of months. Things should really get moving when the K and the D get above 20 on the stochastic.
On the weekly chart we can see downward sloping resistance has turned to support and this is where we see dash consolidation. Very pleasing to the patient.
If I had to pick where we would expect DashBtc to have a major stall against BTC it would be at the 2 level of this fib channel. Maybe the 1.786. Sets up a massive inverse head and shoulders on DashBtc like the one we have been dealing with on ETHBTC.

Dashbtc ready for liftoffDashbtc is following dogebtc to perfection from 2017. As you can see even the time frame is the exact same. Dashbtc is just starting to breakout now and I am expecting it to reach .02+ by the end of Q2 at the latest. ATH for dash before July I am targeting as of now.

$DASH Yet another sleeping giant ready to take off.Key points:
- V bottom;
- Inverse Head & Shoulders;
- Retest of the new transformed support.
TP1 short-term, while TP2 for mid-term.
Huge player in the #crypto space, #privacy-orientated.

DashBTC ready to outperform?Possible Rs till end year?
entry: 4600 satoshi
medium size
leverage: 1:10 /usd
TP=?
medium position in mining U6 to be bought in May


DASHBTC wedge topI mentioned a little over a week ago how DASH looked to be heading upward, but now it looks to have reached the top of a wedge that has been forming since the last breakout.
MACD however looks to be treading well since the last dip. If the upward trend continues, DASHBTC has the potential to breakout to the larger, long-term wedge forming since early 2020 (blue lines). If that were to break upward, that could potentially be a very good sign for Dash.
However, there is also a bit of potential for a push back from either wedge. Either way, it looks to be something interesting to keep an eye on over the next few days.

$Dash #Dash on the moveDash will hit the target, hopefully before it hits the stop loss. not financial advice


Crypto|DASH/BTC|LongLong DASH/BTC
Activation of the transaction only when the blue zone is fixed/broken.
The author recommends the use of anchoring fixed the blue zone, this variation is less risky.
If there is increased volatility in the market and the price is held for more than 2-3 minutes behind the activation zone after the breakdown, then the activation of the idea occurs at the prices behind the activation zone.
The idea is to work out the resistance level .
* Possible closing of a trade before reaching the take/stop zone. The author can close the deal for subjective reasons, this does not completely cancel the idea and is not a call to the same action, you can continue working out the idea according to your data, but without the support of the author.
+ Maybe right now we will go even lower, then it's okay, the idea is not activated and simply canceled.
+ ! - zone highlighted by the ellipse is a zone of increased resistance, in this area there is a possible reversal for a correction, please take this factor into account in this transaction.
The "forecast" tool is used for more noticeable display of % (for the place of the usual % scale) of the price change, I do not put the date and time of the transaction, only %.
Blue zones - activation zones.
Green zones - take zones.
The red zone - stop zone.
Working out the stop when the price returns to the level after activation + fixing in the red zone.
Orange arrow - the direction of take.
Black arrow - neutral scenario without activating the trade.
The red arrow - the direction of the stop.
SUM PNL: This parameter displays the total % of all closed ideas of the "new" format (according to the author) for this sector at the time of publication of the idea. The calculation is very "clumsy" just the sum of the profits of all the ideas, based on this indicator, you can more accurately assess the risks when working with my ideas of this sector. I present you the construction of the idea, you can use it yourself as you like based on your subjective view and risks, the calculation of the PNL indicator is carried out only on transactions that the author closed on TV in manual mode or by take.
P.S Please use RM (risk management) and MM (money management) if you decide to use my ideas, there will always be unprofitable ideas, this will definitely happen, the goal of the system is that there will be more profitable ideas at a distance.

BINANCE: DASH/USDT🛒 Pair: DASH/USDT 🛒
== SPOT==
⏰ 1400/01/15 ⏰
🕰 04/04/2021 🕰
Duration:
📈 SHORT - MID 📈
Ex: Binance
#124
🛒 Buy : 0.0043 - 0.0045 🛒
👉Sell Targets👈
🎯TP1: 0.0049 🥉
🎯TP2: 0.0054 🥈
🎯TP3: 0.0059 🥇
🎯TP4: 0.0065 🚁
⛔️ SL: 0.0038 By Daily candle closure below

DASH DASH MAY BE A SLEEPING GIANT
Most of us know dash from back in the days.. when was very popular
As we can see nowadays DASH is very undervalued ( similar to old EOS )
Give it time
On the chart there is a buy signal i managed to pull out at this time frame, may be an entry for short and also long term (6mo)

Long dash target 0.019 stsI see Dash chart is diverging, wedge model, expect 0.018 - 0.0259 sts, respectively Dash / usd graph is 250 to 350 $

DASHBTC potentially reversingFor anyone watching DASH, it looks like DASH is challenging downward resistance on DASHUSD, but I think the really interesting thing to watch is DASH/BTC. It looks like the relationship just took a huge dip yesterday but now looks like it could be attemping to reverse direction. Still a bit of a ways to go until it hits the trend line, but there hasn't been such a reversal as such for some time now, so I figured it something to point out for anyone watching Dash.
There still needs to be a little more confirmation, but DASH at least came close to the bottom of a potential wedge (green lines) but time will tell if the trend continues. If it does however, it will be interesting if it is able to break through long term resistance (blue lines) anytime soon, but if so, that would be a very positive sign.


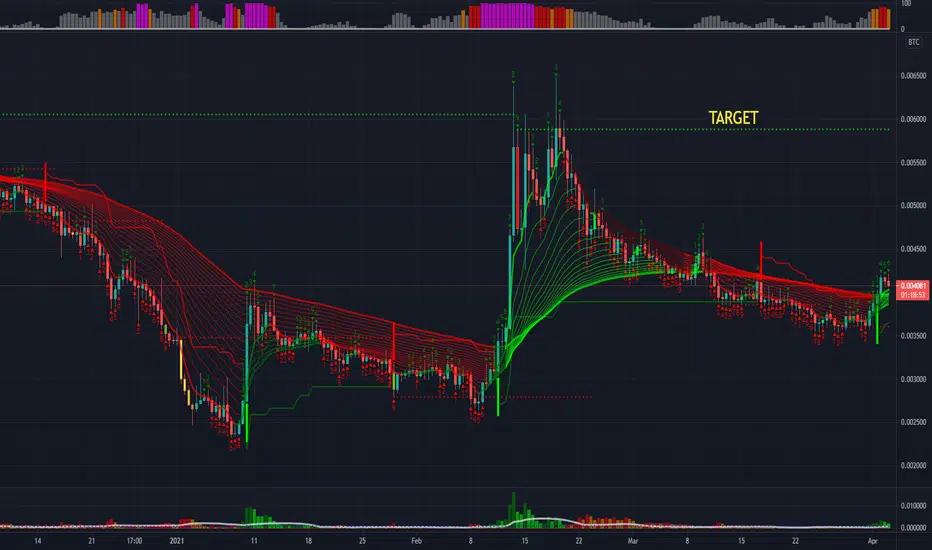
DASHBTC is preparing to move upAfter last pump DASHBTC started to consolidate its price against BTC. around 0,00380 level it found support and as you see on the triangle support line is holding well. Any moment it can brake above 0.00400 level and can be in blue zone. Real price action with volume will come after 0.0042x level passing. As you know DASH is waking up late but when it start to move x2 and x3 can come easily in couple of days.


WAVE 5 Will Start After a Breakout❕ Wave 4 Completed With a Perfect ABC Correction ,Also Sitting Above The Wave 1 Pivot ,Expect The Breakout From The Trend Line Soon
✅ Tp 1 : 5100 (24%)
✅ Tp 2 : 6300 (53%)
✅ Tp 3 : 7600 (85%)
🔴 Stop loss zone : 3300 ~ 3259

Crypto|DASH/BTC|LongLong DASH/BTC
Activation of the transaction only when the blue zone is fixed/broken.
The author recommends the use of anchoring fixed the blue zone, this variation is less risky.
If there is increased volatility in the market and the price is held for more than 2-3 minutes behind the activation zone after the breakdown, then the activation of the idea occurs at the prices behind the activation zone.
The idea is to work out the resistance level .
* Possible closing of a trade before reaching the take/stop zone. The author can close the deal for subjective reasons, this does not completely cancel the idea and is not a call to the same action, you can continue working out the idea according to your data, but without the support of the author.
+ Maybe right now we will go even lower, then it's okay, the idea is not activated and simply canceled.
+ ! - zone highlighted by the ellipse is a zone of increased resistance, in this area there is a possible reversal for a correction, please take this factor into account in this transaction.
The "forecast" tool is used for more noticeable display of % (for the place of the usual % scale) of the price change, I do not put the date and time of the transaction, only %.
Blue zones - activation zones.
Green zones - take zones.
The red zone - stop zone.
Working out the stop when the price returns to the level after activation + fixing in the red zone.
Orange arrow - the direction of take.
Black arrow - neutral scenario without activating the trade.
The red arrow - the direction of the stop.
SUM PNL: This parameter displays the total % of all closed ideas of the "new" format (according to the author) for this sector at the time of publication of the idea. The calculation is very "clumsy" just the sum of the profits of all the ideas, based on this indicator, you can more accurately assess the risks when working with my ideas of this sector. I present you the construction of the idea, you can use it yourself as you like based on your subjective view and risks, the calculation of the PNL indicator is carried out only on transactions that the author closed on TV in manual mode or by take.
P.S Please use RM (risk management) and MM (money management) if you decide to use my ideas, there will always be unprofitable ideas, this will definitely happen, the goal of the system is that there will be more profitable ideas at a distance.

DASH/BTC in for a bounce or a breakI have already mentioned a couple of ideas about DASH (which I normally do not follow so closely), but this chart looks to show it best. Ultimately, DASH/BTC looks to either be in for a bounce off the bottom of its trend very soon, or a break below it.
With the current trend already heading upward, here is hoping for a bounce, but as always with crypto, nothing is for certain, particularly if BTC heads downward.
Either way, the next few hours/days look to be where some movement is expected, potentially into a wedge until mid-March.

DASH/BTCHi guys
i just saw something intersting!
please dont say anything just imagine if it happends for one moment...
it will be magical... lol
what do you think?
good luck my friends
bb
