DASHBTC trade ideas

dash btc distributionblue for certain dates
red for bottoms around those dates
uber bearish as many alts are


Midterm swing trade on DASHBTCHi traders,
Here a nice and clean (Swing) trade setup for dash BTC..
---Team Crypto Guide---


Dash AnalysisHello Traders,
Dash is above an very important support. The last times when we reached this level the price pumped dramaticaly. I would keep my attention to dash in case that this coin start another bull-run specially if it does a candlestick reversion or if it break out the red line.
Please push like button and follow us.

DASHBTCIt is a ranging market and this will need a bullish volume to spring up because 0.0063 is a strong area.
But we don't believe a bearish bias is ideal.
All of my market shared technical set-ups are speculative, they are not guaranteed for accuracy or in completeness in the form of any content. At this profile page, the analysis, ideas and also, the strategy of a chart belongs to Khiwe; -it is not to advice on financial markets; please apply your own analysis and confirm it with price action.

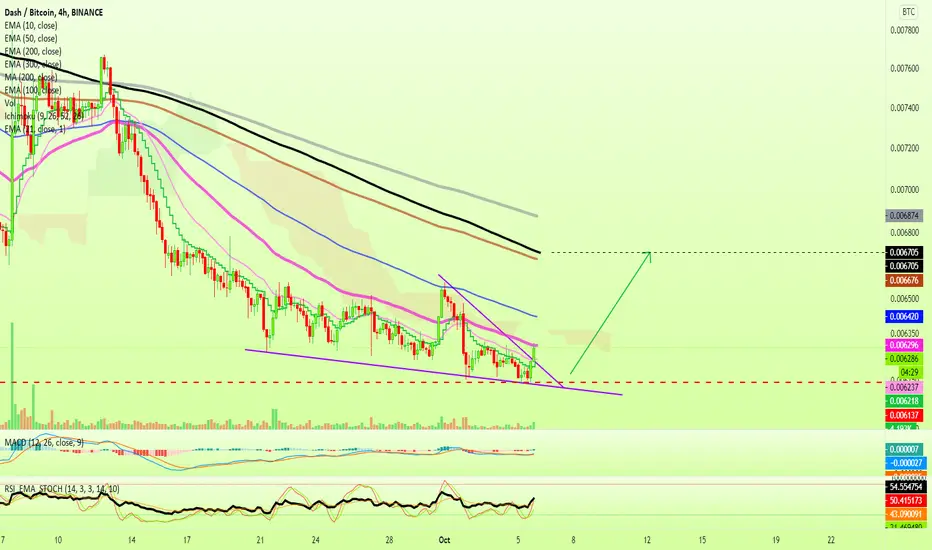
Dash Starts To Recover (Next target mapped)Here we have mainly early signals... But DASHBTC is looking like it wants to stop printing red.
Prices are now trading above EMA21 and EMA10.
We have a challenge of EMA50.
The RSI is above 50.
Bullish divergence on the MACD and RSI.
The bullish divergence is a strong signal when it shows up on both indicators, the MACD and RSI.
Prices are likely to jump.
Our next target is set at MA200 (the black line on the chart).
Namaste.
DASHBTC, Will it repeat?It will be a good signal for us if we will see a volume increasing ner the Support level.
The price falls almost a full year to this level and can bounce off.
It will be a good trade with low risk and potentially big profit.
Push like if you think this is a useful idea!
Before to trade my ideas make your own analysis.
Thanks for your support!

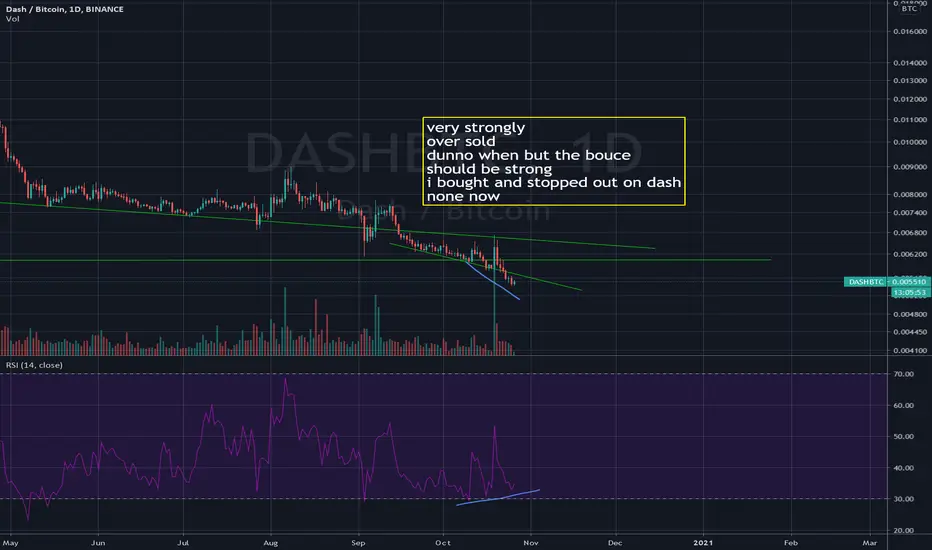
DASHBTCDash looking ready to break out in the next coming days worth keeping a watch.
I've marked out potential support/resistant areas to keep an eye out for wait for the breakout of the descending triangle for long opportunities.
Also well under bought on the RSI

DASHBTC - 1W - Dash could go higher soonAs you can see on the weekly chart for DASHBTC
- Bollinger bands are really tight in weekly TF
- reaching end of triangle soon (support must hold)
- MACD flat
TPs are on the chart (used ichimoku)


DASHBTC - 1D - Dash first small breakoutLooks like dash broke the yellow resistance.
Bigger resistance is shown with red line.
2 possibilities if btc stay flat :
- can't break the red line, back to yellow line tp 0.0079
- break the red line, tp1 0.0096 / tp2 0.0107

DASH vs BTC ---LONG--- 24.08.20#DASHBTC
Type: LONG
Buy at: 0.0072 - 0.0078
Size: 8%
Target:
1) 0.0086
2) 0.0098
3) 0.0116
SL: below 0.0068

Dash Look Like create Ascending WedgeToday i want to publish my ta for dasht/btc
i think if this Ascending wedge does not break we can except that dash goes higher


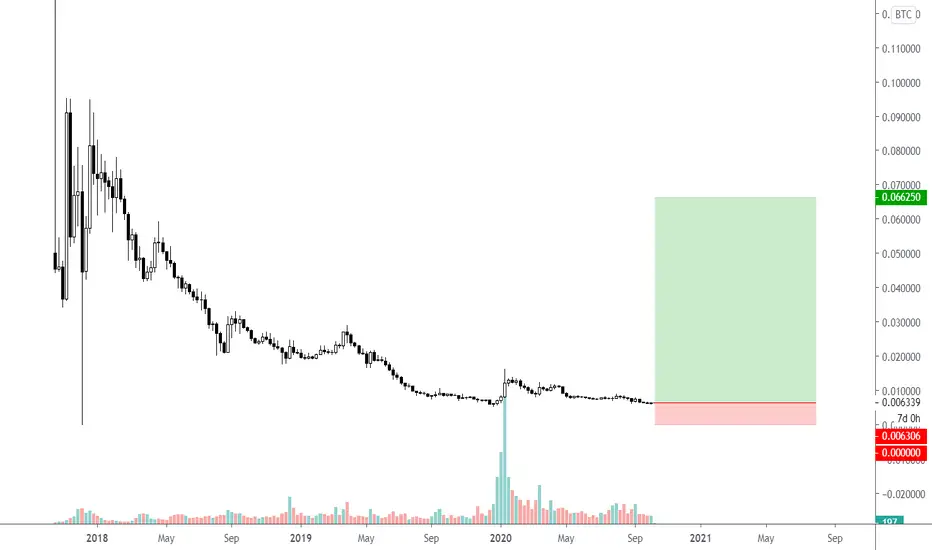
DASH Huge Falling Wedge or Descending Triangle?This chart shows a very long accumulation after the move up in 2020.
We can see a good volume during August while the price is ranging in the lows of the Descending Triangle.
I would expect it to pop higher Before October

DASH/BTC - Small falling wedge in a bigger oneWe are currently trading in a small falling wedge (yellow lines).
This wedge could break up soon.
If you zoom out on the chart you can notice this wedge is part of a bigger falling wedge (resistance is shown with red line).
Once the small falling wedge breaks, the first target is the first blue line at 0.00794 which represents the bigger wedge resistance and also an ichimoku flat kumo resistance.
This there is enought volume + stable BTC, the bigger falling wedge could also break up :
first targets : 0.0096 / 0.0107
Otherwise we are good for another leg down (but DASH is sitting on a strong support)
MACD crossing green soon in daily TF
