Afraid of 2nd DASH scenarioAfraid of 2nd DASH scenario. What do you think, what is more likely scenario?
DASHPERP trade ideas

DASH/USDT - Potential 139% SetupHello Traders!
The upward movement of DASH has received a deep correction.
At the moment the price returned to the active trading range of $138 - $176
Purchases can be considered between $138 - $160
It would be a good idea to place a stop loss at $94
The medium term buying targets will be
$240
$290
$332
Excellent risk/profit ratio (above 4)
Good luck and watch out for the market
P.S. This is an educational analysis that shall not be considered financial advice

DASH is going parabolic very soon ! Possible retest of ATHDASH is following a very similar structure that XRP followed back in 2020.
In both structures ,after the initial rise ,there was a backtest of the breakout level followed by the breakout where in both structures there was a distribution phase before the capitulation and after the bottom was set in ,there was a backtest near the bottom.
In both structures ,the bottom in wave 4 was set on top of the high made in wave 1.
In XRP wave 5 target was measured by using the 4.236 extension using the top and bottom of the correction.
Here in case of DASH ,4.236 lies near 1700usd which is close to its 2017 All time highs.
Using the rally prior to BTC's capitulation ,DASH extends to about 3500USD.
It makes logical sense for dash to get some sort of rejection at its previous ath before its rally to 3500usd.
#Altseason2021
#NFA

DASHUSDSL: 162.061
TP: 214.817
RRR: 2.4
Price is showing clear indication of respect to the 4hr and daily line of support, thus reflecting a potential rise in the market.

DASHUSD LONGDASHUSD LONG
SL:180.247
TP: 213.013
RRR: 2.05
Price faked out of a 4hr trend and is coming off a respected line of support.


DASHNO change. I'm still aiming for 400 in the medium term. Currently drawing a triangle that we seem to be breaking up out of for a reversal. See previous DASH chart for bigger picture


DASHThis is a close up of the daily falling wedge it has been breaking out of that will take us higher. See previous post for the bigger pciture

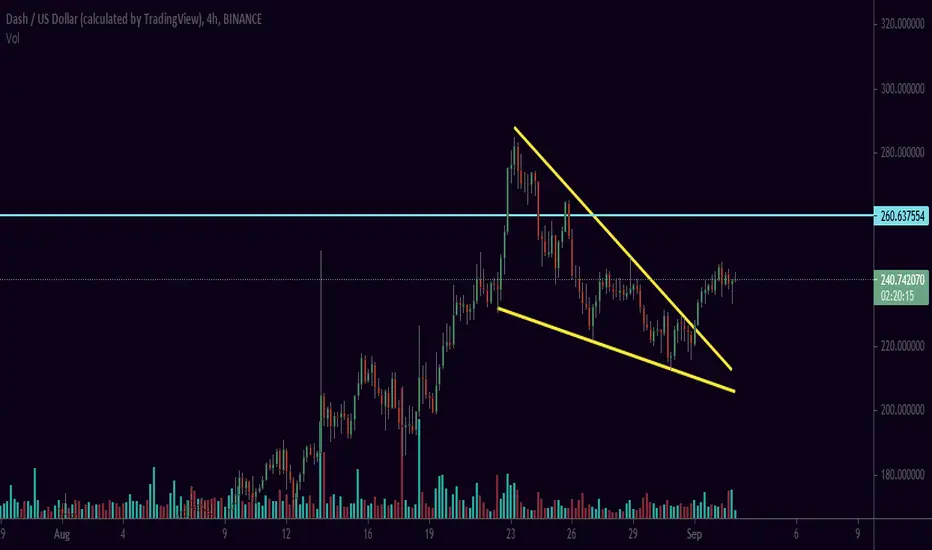
DASH, on triangle.DASH, price already broke on the triangle. There is a resistance though at 260. Will the price break from the resistance.
Dash breaking outAlt coins are all running one by one. Dash is almost ready for a bull run as it's breaking out from bull flag. Waiting fora break above 146$ to take a long position.

DASHI am extremely bullish on dash and think we will continue to atleast the purple or orange area. Nice falling wedge on the weekly popping off WHILE another falling wedge on the daily is popping off. the daily is also bouncing off a major support level/ The declining volume looks fantastic

DASH/USD - Shortest bull cycle ever?I like to put things in perspective.
To me it's a rhetorical question obviously and I DON'T think this was a bull cycle, rather just the beginning of it.
Have you done your homework too?

DASHDASH should be breaking out of this formation soon. My guess is to the upside because the market is on fire. Entry would be on the breakout.

Dash (DSH/USD) 1D: Elliott Wave Analysis👋 Hello and welcome traders to another trade idea with SunnyHillCapital
☝️ Firstly, if you like what you see, please support our work by writing a comment and SMASH that like button! 👍 Let's catch these moves together! ✅
💡 Why should you follow our profile on TradingView?
Consistent chart updates
Clean charts
Short and long-term perspectives
Visually teaches you valuable lessons
High probability setups
Analysis on a wide range of major markets
SMASH that follow button! 👍
💡 Leave a comment and/or message us on how we can improve and provide better content, we are open to suggestions to create a better experience for you!
Keep in mind that the analysis provided is not 100% accurate and that you can never be certain with the markets. This information given is not financial advice, always do your own research.
Thank you for reading,
Cheers to many pips! 🤝

DASH simple s/r flip As we can see DASH has shown an HTF s/r flip. If it holds support in the green area it leads us to a $280 first price target, completing the market cycle on the 1D. Next target would be the 2nd black line, which would be the weekly S/R and weekly candle that led to the sell off in may. Stop loss / invalidation below green zone

DASH Long - The bigger picture & theoretical top $6700SUMMARY: If we are in a crypto super cycle - not sure about it - however, we could be looking at a top, on a TA basis, of DASH =$6700
Following Elliot Wave theory, a super cycle could take us up to the $6700 market.

resistances in the way of $1100 or $1260resistances in the way of $1100 or $1260:
R1=$344
R2=$403
R3=$595
R5=790
R4=$910

DASH.usd near term Support Resistance map, $26x maybe local topPlotted are 3 different fib series from different time frames.
The thick Gold and Blue levels are from a very high tf fib series.
The others are local, including one for the last leg up from $185.
$ 265 - 268 would make for a good topping zone.
$ 232 - 233 is a good immediate support to hold.
$ 233.45 Golden fib is a MUST-Hold to keep trend.
For reference, here is the "Big" fib with the thick lines (weekly timeframe):
.
I do not use "Fibs" in the "traditional" manner (retracements).
I use Fibs to plot "Ripples" (extensions) created by "Impulses".
Then look for "Confluences" to map the "interference Pattern".
My TV collection of ideas detailing the Concepts:
Chapter 1: Introduction and numerous Examples
Chapter 2: Detailed views and Wave Analysis
Chapter 3: The Dreaded 9.618: Murderer of Moves
Chapter 4: Impulse Redux: Return to Birth place
Chapter 5: Golden Growth: Parabolic Expansions
Chapter 6: Give me a ping Vasili: 'one' Ping only
Chapter 7: The Mighty 2.618: like a Rook in Chess
.

DASH Cup and Handle with Eliot AnalaysisAccording to the chart via the strong pivot resistance line which has crossed with blue color, already, has illustrated cup and handle at this time (daily & 4H time frame).
As the result chart has bullish pattern with cup and handle, plus, our cup and handle target is about approximately between 268$ and 274$ , in addition, could be created Eliot pattern with Fibonacci overlap lines on 50% 78% 161.8%.
however, RSI in daily time frame shows us the price might drop, although, RSI in 4H time frame already looks bullish.
To sum up, Dash might pump up caused its chart patterns, moreover, BTC price might affect on the DASH`s price. For taking position, it`s necessary to watch BTC.D, USDT chart and also USDT.D chart to take a better position on the coin.

