Bullish Gartley With 4HR RSI Bullish Divergence If you can hold the zone between the 786 and 886 i wouldn't be surprised if you see a major pump back to the top half of our range here
DASHPERP trade ideas

DASHUSD ForecastDASHUSD falling at the H3, the nearest support is 145.132.
.
Khiwe
At this profile page, the shared analysis, ideas and also, the strategy of a chart belong to Khiwe with some being influenced. The technical set-ups are speculative, they are not guaranteed for accuracy or in completeness in the form of any content; -it is not to advice on financial markets. Please apply your own analysis and confirm it with price action.


hit first target and retest of neckline (h&s reversal)hit first target and retest of neckline for the h&s reversal/bottom. Next target 1600 area (ATH) 800% from here. Good luck guys

DASH dashing lower DASHUSDIt is beginning to sound like a broken record now, but we got to remain objective. The charts are quite clear that we are going lower, yet it remains to be seen how much lower in the short term anyway.
Fibonacci goals is in green, cancellation/setup rejection is in red. This is not some kind of financial advice for your portfolios, so do your own research and make your own decisions about your trading or investment related moves.

Dash (DASH) - June 16Hello?
Welcome, traders.
By "following", you can always get new information quickly.
Please also click "Like".
Have a good day.
-------------------------------------
(DASHUSD 1W Chart)
If the price holds above the 165.21626486 point, we expect the uptrend to continue.
(1D chart)
It needs to rise above the 197.43788317 point and find support to turn into an uptrend.
If it goes down, you should check to see if it finds support at the 143.62557443 point.
If possible, we recommend moving along the uptrend line (1).
If it falls from the 143.62557443 point, it enters the mid- to long-term investment area and it may take a long time to rise, so careful trading is required.
-------------------------------------
(DASHBTC 1W chart)
We should see if we can climb to the 0.005698-0.016067 section and form a box section.
To create a new rising wave, it must rise above the 0.016067-0.020848 section.
(1D chart)
If it goes down, you should check to see if it finds support in the 0.003742-0.004199 zone.
In order to turn into an uptrend, it needs to rise above the 0.005114 point and find support.
The downtrend is expected to continue until it deviates from the downtrend line (1).
However, if it rises above the 0.005698 point and finds support, I would expect it to break out of the downtrend line (1).
------------------------------------------
We recommend that you trade with your average unit price.
This is because, if the price is below your average unit price, whether it is in an uptrend or in a downtrend, there is a high possibility that you will not be able to get a big profit due to psychological burden.
The center of all trading starts with the average unit price at which you start trading.
If you ignore this, you may be trading in the wrong direction.
Therefore, it is important to find a way to lower the average unit price and adjust the proportion of the investment, ultimately allowing the funds corresponding to the profits to regenerate themselves.
------------------------------------------------------------ -----------------------------------------------------
** All indicators are lagging indicators.
Therefore, it is important to be aware that the indicator moves accordingly with the movement of price and volume.
However, for the sake of convenience, we are talking in reverse for the interpretation of the indicator.
** The wRSI_SR indicator is an indicator created by adding settings and options to the existing Stochastic RSI indicator.
Therefore, the interpretation is the same as the traditional Stochastic RSI indicator. (K, D line -> R, S line)
** The OBV indicator was re-created by applying a formula to the DepthHouse Trading indicator, an indicator disclosed by oh92. (Thanks for this.)
** See support, resistance, and abbreviation points.
** Support or resistance is based on the closing price of the 1D chart.
** All descriptions are for reference only and do not guarantee a profit or loss in investment.
Explanation of abbreviations displayed in the chart
R: A point or section of resistance that requires a response to preserve profits.
S-L : Stop Loss point or section
S: A point or section where you can buy to make a profit as a support point or section.
(Short-term Stop Loss can be said to be a point where profit and loss can be preserved or additional entry can be made through split trading. It is a short-term investment perspective.)
GAP refers to the difference in prices that occurred when the stock market, CME, and BAKKT exchanges were closed because they are not traded 24 hours a day.
G1 : Closing price when closed
G2: Opening price
(Example) Gap (G1-G2)

narrative vs the chartthe rest is noise. "the bull market is over after the retest of the reversal of trend" said nobody. 1600 is next

DASHI think resume upward momentum here, even if only to retrace after this insane sell off that has taken dash back down 75% from the highs back in April.

DASHUSD ForecastYou'll get to hear about "The three black crows"...such things are interesting. What is the real meaning of those crows? What omen do they tell, or is it just price-movement ?
DASHUSD -Bullish at the H2
.
Khiwe
At this profile page, the shared analysis, ideas and also, the strategy of a chart belong to Khiwe with some being influenced. The technical set-ups are speculative, they are not guaranteed for accuracy or in completeness in the form of any content; -it is not to advice on financial markets. Please apply your own analysis and confirm it with price action.


Dashusd following downtrend for swing sellI am a beginner but I like dash used for smaller accounts. Here in the 4 hour dashusd chart, we can see that price is trending down. Previous lows are in the 181 range and 169 or so before that. I expect price to fall below 181 and maybe even further.


$DASH breakout confirmed. Next level $245-$250While some coins reside within their triangles, $Dash has clearly broken above. The next logical resistance comes at the next Fib and start of the candle where we started our descending rail

“Dashuas”If we are actually heading to phase 3 of the crypto bull run. Large caps are gonna go parabolic . If this is the case I can see dash coin hitting 3k-12k max before Jan, 2022.
I repeat do not sleep

$DASH Resolution Coming Soon!!!$DASH remains below its .236 Fib, and is now entering a reactionary point on the chart. My belief is that the impulse will be rather large. The direction of that move will be based off the way it breaks. If we break down, I see a possible retest of the lows. If we break up the next FIB that makes since is the .5. Keep an eye on it. :)


DA$H Cup and HandleCup and Handle for Dash
Bit abstract but it works
Price is currently testing the 200MA for the first time
The major trend line reclamation would be congruent with Ethereum's recovery of its Trendline in the idea I attach below

Consolidation= big move updash has been moving sideways for a few days, I expect a big move towards the upside hopefully

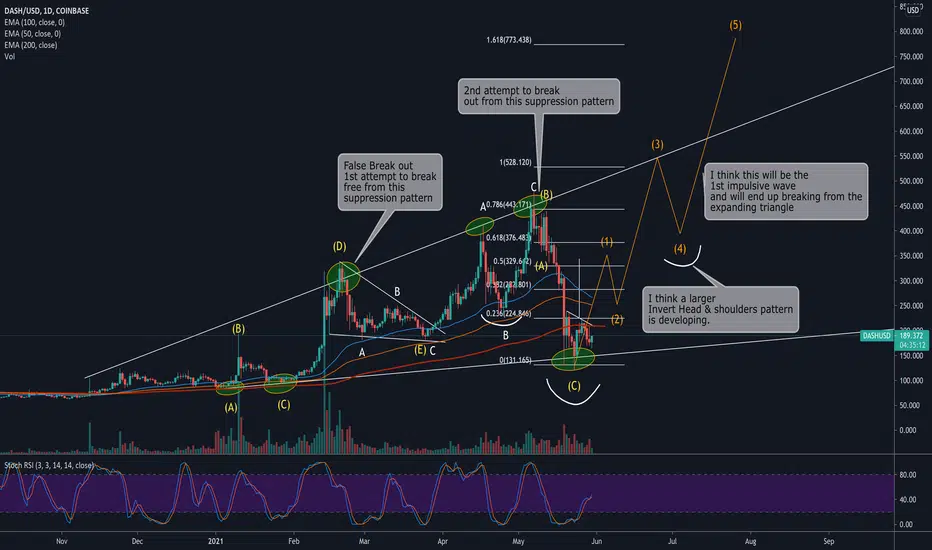
DASHGoing off the coinbase chart my analysis points to the following:
1. DASH is lagging the other coins big time as it hasn't even broken free from the corrective phase.
2. We could finally be making the push to an impulsive wave break out.
3. There is a larger potential IH&S pattern developing.
I would note that I am starting my EW studies so please DYOR and also if you are an EW analyst please leave a comment as to your thoughts.
Also DASH is lagging 2017 ATH's by about $1400. This lends bias and credibility to my theory that DASH is just in some large complex correction.
This is also highly speculative and you should do your own TA before investing.
My analysis and my bias and my gut is all pointing towards DASH will soon revist ATH's from 2017 then re adjust price versus $40-$50k BTC.

Dash 🚀Dash is looking good here. Notice how it hit the top range of the parabola and dropped back down to the bottom of the parabola just like 2017. I believe that after a few weeks we will start heading back up and then rally with a peak early Q4 near 5k.

