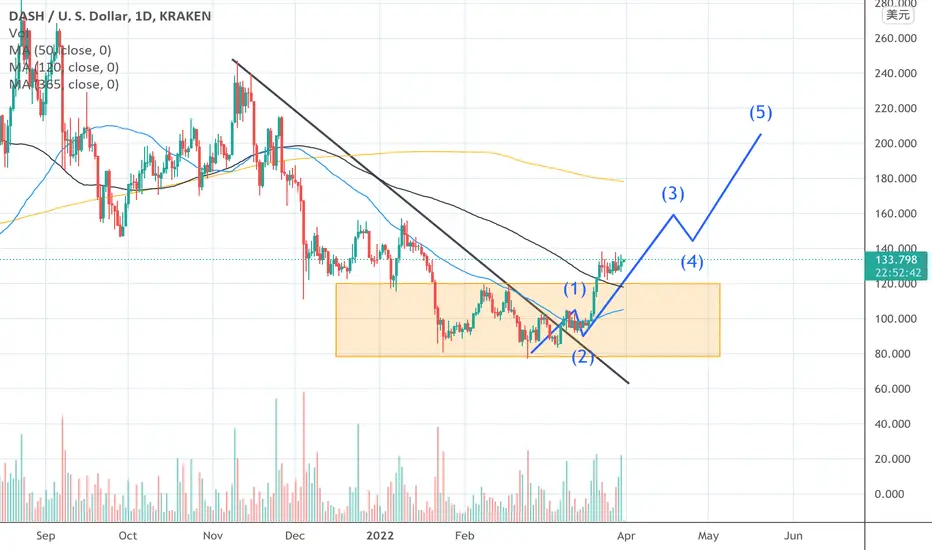
Dash looks good from here 👍Dash could break out after this long descending triangle, 90 dollar area is sinds 2017 a support line.
Hopefully we'll see some decent uptrend next few monts to come.
DASHPERP trade ideas

BULLISH RUN IS GOING If you miss the buy , buy it now and also in Coinbase too.
The green is screaming for the bulls and played the support very well and thanks to the meta share had been going on.
Bullish trend and big push up; watch any reversal happens.
Time to go to the moon

Dash 2 week outlookHello Traders,
Here is a long term chart on DASH, same deal for the colors. Pink we want to stay above, if not, green lines are the points of interest for buying opportunities. Red rays are resistance and white lines are targets when the light blue trend lines are broken.
If you look at the previous run, this all looks very similar to the present run but on a larger scale.
Please leave a comment with your opinion and requests for additional charts.
Savvy

DASHUSD (1H) Bearish Wave We2Hi Traders
DASHUSD (1H Timeframe)
A high probability, entry signal to go SHORT will be given with the downward break of 93.50 after the market found resistance at 96.35. Only the upward break of 96.35 would cancel the bearish scenario.
Trade details
Entry: 93.50
Stop loss: 96.35
Take profit 1: 88.80
Take profit 2: 84.10
Score: 8
Strategy: Bearish Wave We2

TRIPLE bottom dashusdeasy 200% for dashusd
go check there website and learn more about dash
sl bellow the bottom

DASH/USD Main trend. Price reversal zone.This chart shows the main trend of this cryptocurrency. Term 1 week. The idea is to understand where the price is on a global scale and what to expect. It is advisable to trade on a lower timeframe, but a large timeframe gives you an idea of what to expect in the future.
Pay attention to what formations have formed on the chart and how they can "flow" into each other, depending on how the situation develops in the reversal zones. Now the price is in the reversal zone below the line of the secondary downtrend. Which trend will dominate in the near future depends on this zone.
If a breakout occurs and the price consolidates above the resistance of the secondary trend (the resistance of the triangle) - a complete reversal and the emergence of a new upward secondary trend. If the price fails to break through and gain a foothold above this zone, it may roll back inside the triangle to support - the next reversal zone, and this is the level of 62.22. Next, you need to see how this support will react.

DASH/USD Main trend. Timeframe 1 monthMain trend. Term 1 month. Updated my previous main trend idea (long term) posted on 11/17 /2022 before the secondary trend reversal.
At the moment, a descending wedge has formed in the secondary trend. The price is near a potential reversal zone.
The idea on such a timeframe is to understand the main trend of this cryptocurrency and where the secondary trend zone is to trade.
Old idea of the main trend.
Precisely a trend reversal from the price of $85.18 to $380 and a reverse trend reversal from the resistance zone of 380. Profit + 518%
DASH/USD Main trend. Price reversal zone.

5I would like this idea on my public profile only, I don't mind if it's not in the trading view ideas section.

DASH Long TP At $1500.00 Dash is currently finalizing a descending wedge pattern. Very Bulish pattern. First TP at $1500.00

DASHUSD (4H) Bullish reversalHi Traders
DASHUSD (4H Timeframe)
Waiting for the upward break of 111.20 resistance level, which will complete a bullish trend reversal pattern to go LONG. Only the downward break of 100.55 would cancel the bullish scenario.
Trade details
Entry: 111.20
Stop loss: 100.55
Take profit 1: 117.25
Take profit 2: 127.60
Score: 7
Strategy: Bullish reversal


DASHUSD LongOverall Average Signal from all our indicators suggests a Long. Entry is at market open and exit is shortly before market close or whenever you are okay with profits.

FlagDASHUSD appears to have formed a flag. A flag is a consolidation pattern and usually slopes against the prevailing trend. The trendlines on this flag is almost almost so far which is acceptable. The pole is UP so this would be defined as a bull flag. Possible stop below trendline after a break.
You can project pole up or down from the trendline to get a ballpark guesstimate of where price may go.
A flag can go either way and entry is when price breaks a trendline with a trend in that direction.
No recommendation.

DASH startDASH has broken through the consolidation range
will rise in the short term
Follow me to take you to achieve financial freedom
$DASH Long SetupExpecting Flag Brag Sometime this week, will need a couple days to consolidate. Room back to daily 200SMA

Dash Can Make a Move UPAfter breaking out of the long term down trend triangle Dash looks to be attempting to form a bottom. Possibly move up to the big red line in the short term.

DASHUSD (4H) Bullish BreakoutHi Traders
DASHUSD (4H Timeframe)
The market is in an uptrend and we are waiting for an entry signal to go LONG above the 139.00 resistance level. Only the downward break of 121.70 would cancel the bullish scenario.
Trade details
Entry: 139.00
Stop loss: 121.70
Take profit 1: 149.40
Take profit 2: 166.00
Score: 8
Strategy: Bullish Breakout

DASH/USD Aims to Push HigherLonging DASH at 129.11, 15 minute break of structure and waiting on retracement now.

Dash Bull Flag FormationNew to this, trying this out to see how it plays out. Looks to follow the standard bull flag pattern.
1) Spike in trading volume during flagpole phase
2) Followed by lower volume during current consolidation.
3) Looking for a breakout on higher relative volume to continue the upward trend.
Let me know if my interpretation of this pattern is correct and feel free to share your own thoughts.
Not trading advice.

History Tends to Repeat ItselfDash is in a mega wedge. We've seen this before. Get ready for the rally of a lifetime in Dash

DASH/USDT ShortShorted DASH last night, price has crawled higher tapping into 131.83 level and starting to see bearish rejection in this zone. Shorts below 126.90, potential scale in, overall targets 114.45 and 106.67.

Dash Still wedging and on pace to hit $2k Per coin2k coming soon. Dash is still massively undervalued for the utility that it brings.
