DASH D TriangleI'm labeling the tightening range that began in early July and a triangle (blue ABCDE) which would be in its final stages.
The gray descending trendline should serve as resistance for another leg down below 19.
A break of 27.39 invalidates this count.

Dash Grew 1,426% In 2021; New 1,000%+ Bullish-Growth PotentialMy dear friends, this is an interesting chart and we have plenty of data to consider. This is a Tether (USDT) pair —DASHUSDT.
The all-time low was hit just now, August 2024. A double bottom is also present, July 2024. This is great news for Dash lovers, as it signals that the market is ready to tur

#Dash Ready for a Massive 426% Breakout? The weekly chart of #DASHUSDT is showcasing a massive descending wedge pattern, a formation often signaling a major reversal. Currently priced at $25.50, DASH has the potential to skyrocket to $107.35, marking a staggering 426.78% gain. This setup hints at a significant bullish momentum building up—

DASHUSDT - In Bullish TrendDASHUSDT in bullish trend without divergence. The analysis is done on an hourly chart. An early entry is planned by placing a pending order of Buy Stop. Entry point is decided by using FIB @ 0.236.
The Signal is:
EP: 26.82
SL: 25.67
TP: 27.97

DASH analyssi (4H)After the X wave, it has entered a correction phase.
It is now near the premium part of the previous wave.
From the supply range, it can move towards the specified targets.
Closing a daily candle above the invalidation level will be a violation of the analysis.
For risk management, please don't

DASH Price ActionDASH is currently in a bearish trend and has been moving under a trend line for approximately 157 days. The chart clearly shows the price making lower highs and lower lows, respecting the boundaries of this channel.
Currently, the price is consolidating on the support zone Green. For a bullish mov

DASH sell/short setupThe structure of DASH is bearish. There is a good swap range ahead. This is a resistance zone.
If DASH reaches this range, we will look for sell/short positions.
Closing a daily candle above the invalidation level will violate the analysis.
Note that the financial market is risky, so:
Do not ente

#DASH/USDT is heading towards the Diagonal Trendline in 4-Hour T#DASH/USDT is heading towards the Diagonal Trendline in 4-Hour TF!
NASDAQ:DASH needs to break the Diagonal Trendline to turn bullish. Wait for BO to Open Long. The next local resistance level is PMH $28.87, and the support level is PDL $23.94.

DASHUSDT in Bullish TrendThis coin is making a beautiful uptrend and no divergence on RSI scale on an hourly chart. Took an instant entry (Market Execution - BUY).
The Signal is:
EP: 24.59
SL: 23.95
TP: 25.23
RR: 0.5%

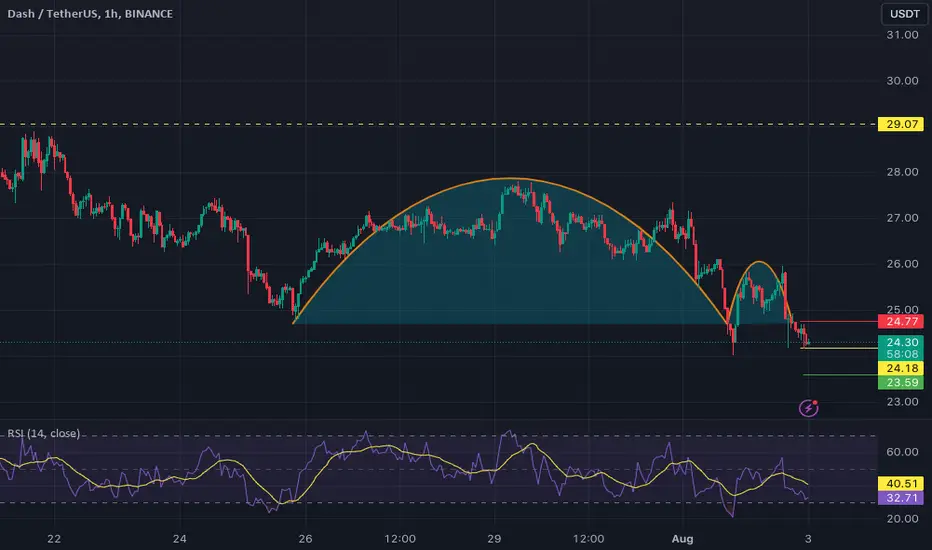
DASHUSDT - Multiple Time Frame Analysis - Bearish TrendI have analysed this coin on 1D, 1H and 15m time frames. The trend of this coin is bearish which I have concluded from 1D time frame. In 1H analysis, it is making an inverted Cup&Handle pattern. I have not observed a divergence in 1H time frame. I took an entry using a 15m time frame.
The Signal i
See all ideas