DASHUSDT 1WDASH ~ 1W
#DASH If you still have Conviction on this coin,. buy gradually on this support block with a target of at least 20%+
DASHUSDT.P trade ideas

DASH USDT💰 #DASH NASDAQ:DASH
Dash ( NASDAQ:DASH ) is breaking out of a symmetrical triangle pattern, indicating a bullish continuation setup 🚀. With strong support around the Fibonacci 0.786 level, the price is poised for a significant rally.
Enter positions near the $40-$44 range during retracements.
Stop Loss: Below $36 to manage downside risks.
Targets:
🎯 Target 3: $85.46

DASHUSDT: Is a Big Move Brewing? Yello, Paradisers! Are we on the brink of a significant breakout or another leg down for DASH? Let’s dive into the chart and uncover what’s next for this coin. Stay sharp this analysis could save you from making the wrong move at the wrong time.
💎#DASHUSDT is currently approaching a key support level around $30.87, a zone that has consistently acted as a springboard for bullish momentum in the past. This level has been tested previously, showing signs of strength. However, if the support fails to hold, it could spark a cascade of selling pressure, potentially dragging the price down to the next lower demand at $25–$26.
💎Currently, the price is under the influence of a descending trendline, with repeated rejections clearly visible. This pattern has kept the bearish structure intact, making a breakout above this trendline a crucial signal for any shift in momentum.
💎A failure to hold the demand zone at $25–$26 could trigger a sharp move downward, leading to bullish invalidation with bearish targets around $16–$20. This would bring #DASH to an untested historical support level and possibly lead to a liquidation event, clearing out weak hands from the market.
💎The RSI, currently in a neutral range, will be critical to watch. A move above 50 on the RSI could support a bullish breakout, while a drop below 40 would reinforce bearish sentiment.
The market is at a tipping point, and taking action without confirmation at this stage could lead to unnecessary losses. Stay patient, disciplined, and wait for clear signals before taking action.
MyCryptoParadise
iFeel the success🌴

Trading opportunity for DASHUSDTBased on technical factors there is a Buy position in :
📊 DASHUSDT
🔵 Buy Now
🪫Stop loss 42.30
🔋Target 46.35
📏 R/R 2,5
💸RISK : 1%
We hope it is profitable for you ❤️
Please support our activity with your likes👍 and comments📝

DASH ready for more bullish actionhi traders
Dash looks great here.
A higher low on the daily time frame is confirmed.
Easy to strategize the trade.
Risk-reward ratio: 2.65
Entry, target, and stop loss are shown on the chart.
Good luck

DASH - USDT UPDATE on 4th January 2025... Where's it off to?Technical analysis hints a downturn... but I've got this "hunch" in my "stomach" that it could actually go up... Do you see my dilemma?
Tread carefully and don’t rush...
Sometimes, it’s smarter to look for other chances instead of jumping into a "half-baked" trade...
Take it easy... You've got the whole year to play the trading game! ;)
PS: here’s a printer-friendly "KISS" chart... and just so you know... leverage *10 on Binance is the way to go... ;)

DASH/USDT - (25-12-2024) G-Money's short version analysis basedDASH/USDT G-Money's short version analysis based purely on technical analysis only, no nonsense or "BS". I do totally ignore any fundamental analysis, technical analysis only
DASH/USDT still kinda on the "move" waiting for a signal to TP. Trade was open with 10X leverage & should bring *2 account size...Who did enter this trade congratulations! Who missed it... See you all next time! ;)
What do you think?
Chart is itself explaining. Kept a "KISS" approach all the way ( "Keep It Simple, Stupid") & beginners friendly... ;)
I do hope that nobody ignoring SL ( Stop Loss) ! Without it, It is a fastest way to loose hard earned money...
;)
Trade safe & don't do "gambling". In the end it never pays, not worth it to risk loose all your $...
PS: above technical analysis is done for the community & educational purpose only! It is not a financial advice. Just share my very own insight to it.
Merry Christmas to ALL !

DASHUSDTTrendline Break: A break above a significant downtrend line signals a shift in market sentiment from bearish to bullish. This is a key technical signal that buyers are starting to gain control.

DASH/USDTKey Level Zone : 39.90-40.47
HMT v2.0 detected. The setup looks promising, supported by a previous upward/downward trend with increasing volume and momentum, presenting an excellent reward-to-risk opportunity.
HMT (High Momentum Trending):
HMT is based on trend, momentum, volume, and market structure across multiple timeframes. It highlights setups with strong potential for upward movement and higher rewards.
Whenever I spot a signal for my own trading, I’ll share it. Please note that conducting a comprehensive analysis on a single timeframe chart can be quite challenging and sometimes confusing. I appreciate your understanding of the effort involved.
If you find this signal/analysis meaningful, kindly like and share it.
Thank you for your support~
Sharing this with love!
HMT v2.0:
- Major update to the Momentum indicator
- Reduced false signals from inaccurate momentum detection
- New screener with improved accuracy and fewer signals

Toward $50The price has got above the weekly kumo cloud to I think it could go to $50.
Here are some intermediary levels also.

DASH looking very strong, could get to $70-$80 region soon (40%)Dash is showing strong momentum towards highs from 2023 , between $70 to $80 region soon, its above the vwap from the 2021 highs with some confluences like fibonacci levels, monthly level, strong resistance and higher timeframes suggesting a continution.

DASH Wave 4 CompleteThe resistance was quickly broken and wave 3 went all the way up to $70.
The swift correction found resistance in the gray zone, which I'm considering to be black wave 4.
In my primary scenario, we're back in the uptrend for black wave 5.

DASHUSDT 1WDASH ~ 1W
#DASH If you still have Conviction on the coin,. Buy gradually within this support block,. with a minimum target of 20%++

DASH is heading for $72A logical target price, if your Elliott wave and Fibonacci projections play out, would be in the vicinity of the key Fibonacci retracement levels—particularly around the 61.8% ($65 area) or as high as the 78.6% ($72 area) retracement of the prior decline. If the bullish Elliott wave structure is confirmed and momentum is strong, an eventual retest of the swing high near $80 could be possible. However, these should be treated as potential targets, not guarantees.
More Detailed Reasoning:
Identifying Wave Targets with Fibonacci:
Elliott wave practitioners often use Fibonacci extensions and retracements to project potential price targets for each wave. Assuming your scenario of a new 5-wave impulse forming off the recent low is correct, the two key levels to watch would be:
61.8% Retracement (~$65): This is a common target for a robust Wave (3) or as an initial resistance level if price is reclaiming ground lost in the correction.
78.6% Retracement (~$72): This level often comes into play if the trend is especially strong. If Wave (3) surpasses the 61.8% level decisively and doesn’t encounter heavy selling, the 78.6% is the next logical checkpoint.
Wave-by-Wave Considerations:
Wave (3) Target: Typically, Wave (3) is the most dynamic and might push price to or beyond the 61.8% retracement. If momentum and volume confirm the bullish move, $65 could be an initial target. Surpassing that, $72 becomes the next serious test.
Wave (5) Potential: If the structure unfolds in textbook fashion and there’s enough bullish sentiment, Wave (5) could aim to retest the previous swing high near $80, or even exceed it. This final push often comes with weaker RSI momentum and possible divergence, signaling caution.
Market Confirmation:
It’s important to note that these are projected targets based on an Elliott wave scenario and assume the market follows a recognizable pattern. Before making trading decisions, look for confirming evidence:
Momentum (RSI): RSI should trend upwards as the price moves into Wave (3). Weak RSI as price approaches $65 or $72 would be a warning sign.
Volume Patterns: Increasing volume on moves higher supports the bullish scenario. If volume declines as price approaches key fib levels, you might encounter resistance or a failing rally.
Risk Management:
Always remember that no Elliott wave or Fibonacci level guarantees a certain price outcome. Unexpected market developments, news events, or changes in sentiment can derail even the clearest pattern. Plan your trades with stop-loss orders, monitor market conditions closely, and be ready to adjust your targets as real-time data evolves.
Conclusion:
Based on the given Elliott wave and Fibonacci framework, a reasonable bullish target would first be the 61.8% retracement ($65), followed by the 78.6% ($72) if momentum remains strong. A more optimistic scenario might see price retest the previous highs near $80. Use these levels as guides rather than absolutes, and monitor volume and RSI for confirmation as the trend unfolds.

The $DASH /USDT pair is currently trading at $43.34, The NASDAQ:DASH /USDT pair is currently trading at $43.34,
The $40.42 level represents a key support zone aligned with the 0.618 Fibonacci retracement level. This area is significant, as it may act as a launching point for a potential recovery. If the price holds above this support, there is a strong chance of upward momentum targeting the $87 level, as indicated on the chart. This represents a substantial upside potential.
$40 is the critical level to watch for entering a long position, while $87 remains the primary target for a bullish recovery.

1 DASH = 1 XMRI think a whale has cornered the DASH market, this coin historically has had low supply with few holders.
Go take a look at the volume DASHUSDT on poloniex the clues are all of there.
Also, i believe XRP gains will rotate to old coins such as this one.

Bought from the Green BoxThe green box on the chart represents a significant buyer zone, and I executed a long position after observing price action within this area. This analysis will break down why the green box was identified as a demand zone and my expectations for DASHUSDT's movement.
1. The Significance of the Green Box
The green box marks a strong demand area where buyers have previously stepped in, making it a high-probability zone for a bounce.
Key Support Zone: This area aligns with historical support levels and technical confluences, reinforcing its strength.
Market Structure: Price has maintained higher lows above this zone, signaling a bullish continuation pattern.
Volume Confirmation: Increased buying volume near the green box suggests active demand.
2. Why I Bought Here
The decision to buy was based on the following confirmations:
Price Action Signals: A bullish reversal pattern formed within the green box, confirming buyer interest.
Fibonacci Retracement: This zone aligns with the 0.618–0.786 retracement of the previous upward swing, a classic area for reversals.
Oversold Conditions: Momentum indicators like RSI showed oversold conditions, adding confidence to the buy decision.
3. Current Expectations
Based on the price action and market structure, I anticipate the following scenarios:
Primary Target: The first target is set at the nearest resistance level, which aligns with previous highs around $XX.XX.
Secondary Target: If momentum continues, the second target is the $XX.XX level, corresponding to a Fibonacci extension level.
Stop-Loss Placement: My stop-loss is set just below the green box to minimize risk in case of invalidation.
4. Strategy and Risk Management
Risk management is a crucial part of any trade, and here’s how I’m handling it:
Risk-to-Reward Ratio: The trade offers a 1:3 risk-to-reward ratio, balancing potential gains against downside risk.
Monitoring Key Levels: I’ll be closely watching for volume spikes and resistance breakouts to validate the bullish momentum.
Adjusting Stops: As the price moves toward the target, I plan to trail the stop-loss to secure profits.
5. Final Notes
The green box represents a well-defined buyer zone backed by multiple technical factors. I’ll remain patient and let the trade develop while managing risk effectively.
I keep my charts clean and simple because I believe clarity leads to better decisions.
My approach is built on years of experience and a solid track record. I don’t claim to know it all, but I’m confident in my ability to spot high-probability setups.
My Previous Analysis
🐶 DOGEUSDT.P: Next Move
🎨 RENDERUSDT.P: Opportunity of the Month
💎 ETHUSDT.P: Where to Retrace
🟢 BNBUSDT.P: Potential Surge
📊 BTC Dominance: Reaction Zone
🌊 WAVESUSDT.P: Demand Zone Potential
🟣 UNIUSDT.P: Long-Term Trade
🔵 XRPUSDT.P: Entry Zones
🔗 LINKUSDT.P: Follow The River
📈 BTCUSDT.P: Two Key Demand Zones
🟩 POLUSDT: Bullish Momentum
🌟 PENDLEUSDT: Where Opportunity Meets Precision
🔥 BTCUSDT.P: Liquidation of Highly Leveraged Longs
🌊 SOLUSDT.P: SOL's Dip - Your Opportunity
🐸 1000PEPEUSDT.P: Prime Bounce Zone Unlocked
🚀 ETHUSDT.P: Set to Explode - Don't Miss This Game Changer
🤖 IQUSDT: Smart Plan
⚡️ PONDUSDT: A Trade Not Taken Is Better Than a Losing One
💼 STMXUSDT: 2 Buying Areas

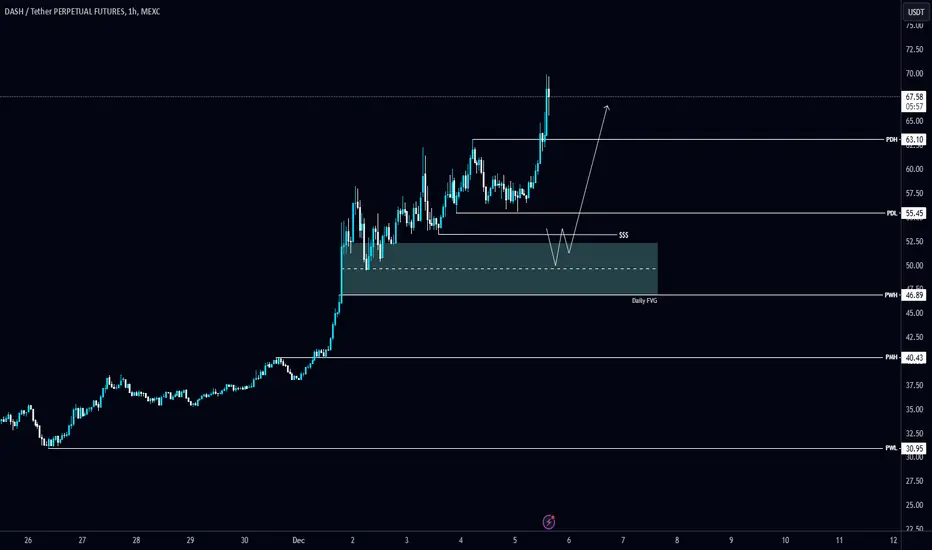
Waiting for #DASH/USDT to retrace back and take the Sell-sideWaiting for #DASH/USDT to retrace back and take the Sell-side Liquidity.
After Liquidity took it will tape to Daily FVG and expecting a bounce from there. NASDAQ:DASH local support level is PWH $46.89.
Dash/USDBullish Analysis for Dash/USDT Weekly Chart
Dash appears to be entering a bullish phase following a significant breakout. Here's a breakdown of the bullish scenario based on the chart:
1. Triangle Breakout as a Bullish Trigger:
The descending triangle pattern, which typically leans bearish, has broken to the upside.
This signals a trend reversal and indicates that buyers have regained control after a long period of consolidation.
2. Key Support Levels for Bulls:
$57.56: The breakout point now serves as immediate support. Holding above this level is critical for maintaining bullish momentum.
$39.72 and $37.05: Deeper supports that indicate the last line of defense for bulls. A breakdown below these levels would invalidate the bullish outlook.
3. Resistance Levels to Watch:
$129.47: The first major target for bulls. This level has historically acted as resistance and will likely face significant selling pressure.
$214.52–$215.23: A critical level to breach for a long-term bullish trend. A break above this could open doors to much higher prices, possibly testing $300+ in the long run.
4. Bullish Indicators:
Volume Increase: The breakout has been accompanied by a notable increase in trading volume, which is a positive confirmation for the bullish move.
Momentum Shift: The recent price action suggests a shift in sentiment, with bulls stepping in after an extended accumulation phase.
5. Short-Term Bullish Scenario:
Bulls should aim to consolidate above $57.56.
A steady climb toward $129.47 would confirm the continuation of the uptrend.
Partial profit-taking around $129.47 could be a prudent move, given the potential resistance.
6. Long-Term Bullish Scenario:
If the price clears $129.47 with strong momentum, the next target is the $214.52–$215.23 zone.
Breaking this zone would signal the start of a major bull run, potentially retesting previous highs near $300 or higher.
Strategic Plan for Bulls:
Entry Points:
Accumulate on pullbacks to $57.56 or trendline retests.
Stop-Loss:
Place stops below $56 to protect against invalidation of the breakout.
Targets:
Short-term: $129.47.
Medium-term: $214.52.
Long-term: $300+ (if momentum sustains).

DASHUSDT have thrust to move bit more“Curious about the full picture? A small hint lies in my about section"
DASHUSDT has bit of firepower where buys till 52 can be done, targetting 63 - 68 range!

Dash Grew 1,426% In 2021; New 1,000%+ Bullish-Growth PotentialMy dear friends, this is an interesting chart and we have plenty of data to consider. This is a Tether (USDT) pair —DASHUSDT.
The all-time low was hit just now, August 2024. A double bottom is also present, July 2024. This is great news for Dash lovers, as it signals that the market is ready to turn.
A turning point now, after three years and a half of red, means the start of the next bull-market. ➢ Dash's bull-market starts now and we are very likely looking at the bottom in August 2024.
Note: The bottom is in, very likely, but, if this isn't the bottom all that is recommend at this point is buy; buy, buy, buy, buy more and hold. Huge potential ahead.
Let's start with the short-term action and expand until we reach the bigger picture.
Currently, DASH is green after producing the ATL just mentioned. The action recently moved back above the low that was hit in August 2023, more than a year ago. This is a strong bullish development and is shown here with a purple line on the chart. While DASHUSDT trades above this level, $22.22 (Aug. 2023 LOW), the bullish bias is active and 100% valid.
There can be swings and shakeouts. There can be panics and all that but this wouldn't change our long-term bias. Even if Dash were to move for a few days or weeks below the above mentioned level, we would still consider it a great long-term hold. This is a solid project and great to diversify as well, specially if you have a big capital and need many options. Are we still doing the smartnodes?
➢ DASHUSDT grew by more than 1,400% in its last bull-market. The low for this cycle happened March 2020, 4.5 years ago. The entire process lasted 420 days. Really solid, looking nice, pretty strong.
We have a lower low, therefore we will not consider a new All-Time High (ATH). Growth potential is still great.
The first target goes for 125% and I think it shouldn't even be mentioned, this is pretty easy. 366% can also be achieved without problem around $114.
Going further, based on technical analysis using Fib. projections, we have 600% as the main target.. This would sit around ~$170.
Knowing Crypto, knowing that the market likes to inspire, surprise and wow!, we have to consider higher targets and these go as follow:
1) 845% at $232
2) 1,089% at $291
Thank you for reading.
Prepare for a long-term bullish ride.
Remember... You are special. You are a divine living soul.
You are the most precious creation of the universe and you are meant to enjoy life, you are meant to experience wealth, health, success and growth.
It doesn't matter what mistakes or errors you've done in the past, the present is now! And you can definitely achieve all of your dreams if you work hard enough.
Thanks a lot for your support.
Namaste.

DASHUSDT Breaks Channel: Bullish Surge Ahead!BINANCE:DASHUSDT Technical analysis update
DASHUSDT has formed a descending channel pattern on the daily chart, breaking above the channel's resistance line. The price is currently trading above the 100 and 200 EMAs. A strong bullish move can be expected once the breakout is confirmed on the daily chart.

DASH Daily ChartAs with most other cryptos, price is pumping for black wave 3. There is no RSI divergence present, so we could still see further upside before a correction.
Pullbacks for wave 4 are long trade opportunities.
Price is currently trying to break strong resistance in the gray zone (44-45).
