#DASH Buyers, Coin Surges 33% from November LowsPast Performance of DASH
DASH prices are solid at spot rates, pressing higher to retest last week's highs. Despite the sell-off early this week, today’s bounce is an indicator that buyers are in control. As it is, DASH is up 33 percent from November lows. Because of the trend set last week and prices rejecting lower lows above $37, traders might find entries aiming to align with the trend of the November 23 bull bar.
#DASH Technical Analysis
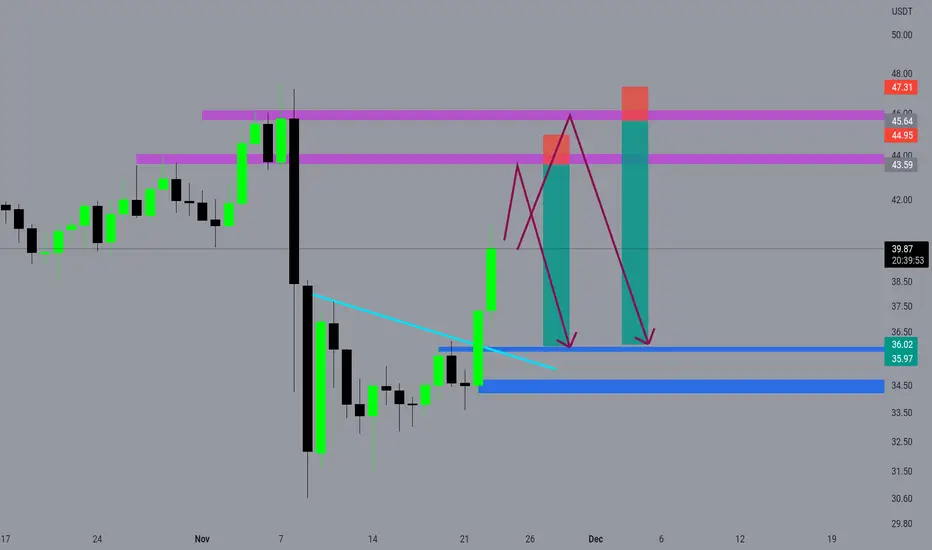
DASH, in response to shifting sentiment, briefly fell on November 28. Nonetheless, buyers are presently in charge per the candlestick arrangement in the daily chart and the sharp expansion in prices points to general optimism. A notable formation is that the November 28 bullish engulfing bar defines the short term. The bar has high trading volumes, even higher than November 8 and 9. At the same time, prices are still within this bar, pointing to strength from an effort versus result perspective. Buyers can look to load the dips above $37, targeting $44 and November highs at $47. Any sell-off below $37 might attract sellers, forcing DASH even lower, invalidating the current bullish outlook.
What to Expect from DASH?
DASH bulls are confident, partly because of fundamental factors and solid candlestick arrangement. As long as prices are steady above $37, DASH may rally, building on last week’s gains, to new Q4 2022 highs in the medium term.
Resistance level to watch out for: $44
Support level to watch out for: $37
Disclaimer: Opinions expressed are not investment advice. Do your research.
DASHUSDT trade ideas

DASH - Buying SignalBYBIT:DASHUSDT.P
1H time frame
-
DASH is forming a potential symmetrical structure.
MACD is going to reverse from negative to positive.
What we need to wait is increased volume.
-
Entry: 41.1
TP: 46.7. 50
SL: 39.9

DASH has been up 26% in the last 24 hours!DASH has been up 26% in the last 24 hours. Its price fluctuates in a medium-term downward channel in the daily time frame. The support that took place in the market the day before caused the price of Dash currency to make a good return from the bottom of this channel. A support area is considered in the range of 37.13 to 38.85 dollars; if Bitcoin continues its short-term upward movement after a correction, we can expect a positive reaction from this support range. In this case, the next target that can be considered is in the range of 54 to 57 dollars. In this case, the ceiling of the descending channel can be broken, and we can expect a pullback to the ceiling of the channel.

DASHUSDT Last attempt to finally break the 1D MA200!*** ***
For this particular analysis on Dash we are using the DASHUSDT symbol on the OKX exchange .
*** ***
The idea is on the 1D time-frame where DASH is approaching the 1D MA200 (orange trend-line) for the 2nd time since the November 08 rejection (FTX). This is the first time since the price broke below the 1D MA200 (December 01 2021) and never touched it again, that it will approach it twice on such a short time window.
This is the ultimate Resistance test for the coin as, as mentioned, it has been unbroken since Dec 01 2021. Ideally, we would like to see a break above the November 10 2021 Lower Highs trend-line, before calling for a long-term bullish reversal on DASH , in which case we can start targeting the Fibonacci levels since its 2021 All Time High, one by one, with the 0.236 Fib (at 58.7) being the first, which was the Resistance on the August 09 2022 High.
Notice also the RSI on the 1W time-frame, which is also making a key test on its August 2021 Lower Highs trend-line. A break there, can possibly be an early bullish reversal indicator.
-------------------------------------------------------------------------------
** Please LIKE 👍, SUBSCRIBE ✅, SHARE 🙌 and COMMENT ✍ if you enjoy this idea! Also share your ideas and charts in the comments section below! This is best way to keep it relevant, support me, keep the content here free and allow the idea to reach as many people as possible. **
-------------------------------------------------------------------------------
You may also TELL ME 🙋♀️🙋♂️ in the comments section which symbol you want me to analyze next and on which time-frame. The one with the most posts will be published tomorrow! 👏🎁
-------------------------------------------------------------------------------
👇 👇 👇 👇 👇 👇
💸💸💸💸💸💸
👇 👇 👇 👇 👇 👇

DASH made 14% today. What's next?Hello, dear TradingView members.
This is a DASH idea.
The price has made a 14% pump today and got rejected by the local resistance price area.
It is now sitting on local support and looks like it's holding.
There are two support levels on the way down and two resistance levels on the way up.
There are two possible scenarios:
Scenario one:
The price gets more support and buy volumes and goes back up to retest the resistance levels.
Scenario two:
The price gets rejected again and falls on the lower support levels.
If you want to open long positions, it's wise to wait for the price to break the local resistance price zone and then open your trades.
RSI is oversold, and the price has more room to go down.
Now let's see your ideas. Let's have a discussion.
Let me know if you guys have any questions;
I will be more than happy to help.
Good luck, and thank you.

DASH ___ Short signalTraders 👋🏻
I think its clear on my chart 👆🏼👆🏼👆🏼
Okay
So enjoy and clime profits ✅
🟣 If you have any questions, ask me. I will answer you immediately. 👇🏻👇🏻👇🏻 🟣
Good luck ✌🏼

DASH - Long-Term View! ✒️Hello TradingView Family / Fellow Traders. This is Richard, as known as theSignalyst.
DASH has been overall bearish for a while and it is now approaching a strong weekly support and round number 30.0 in green.
DASH is forming a channel in red . For the bulls to take over from a long-term perspective, we need a break above the channel and last major high in gray (50.0)
Meanwhile, until the buy is activated, DOT would be overall bearish and can still trade lower inside the 25.0 - 30.0 support.
In this case, as price approaches the support again, we will be looking for short-term buy setups.
Always follow your trading plan regarding entry, risk management, and trade management.
Good luck!
All Strategies Are Good; If Managed Properly!
~Rich

Short entry idea on dash usdt Gartley pattern on 4Hr tf is about to hit short entry (D)
We have also AB=CD that targets PRZ of gartley pattern .
Short entry zone ( D - PRZ)
Targets on fibo mentioned in chart
Stop loss 4Hr candle close above PRZ .

A GLIMSE ON DASH !!!!NEVER A FIN ADVI
PLZ DO UR RESEARCH B4 JUMPING($)
MIGHT HIT 45
plz let me know ur valuable comments...
tradeSAFE

Long DASHDASH found some support and I think it will go up from here . Don't follow me , I'm stupid !

#DASH to 67$?Hello dear Traders,
Here is my idea for #DASH
Price closed above yellow line (previous month high)
Price closed (15min Chart) above purple trigger line to enter trade.
Targets marked in the chart (black lines)
Invalidation level marked with red line
Good luck!
❤️Please feel free to ask any question in comments. I will try to answer all! Thank you.
Please, support my work with like, thank you!❤️


DASH LONG (SWING TRADE)DASH has been accumulating for a very long time already.
It will pop soon. At least 50% upside.

DASH LONGPossible bounce from here just like yesterday although I'm not that confident ! Don't follow me , I eat mud !

Dash Long / Quick ScalpDash Long / Quick Scalp , sentiment has changed , long looks good. Don't follow me , I'm a noob !
Take 2% profit !


#DASHUSDT 4H Chart
Price took out the equal highs and tapped perfectly into the 4h supply where it got rejected from as expected. MACD is not clear, RSI is bought and EMAs are bullish. I am currently monitoring price in order to get involved in shorts towards the 8h demand zone at $40.5.

DASH / USDT⏳We try to provide analysis that covers a specific period of time. Make sure you pay attention to the expiration date.
📌Stay faithful to the Stop-Limit at all times.

DASHUSDT | LONG ON BREAKOUTDASHUSDT has been trading in a bearish trend under the falling resistance.
It has been holding horizontal support for a very long time.
There are multiple attempts by bears but bulls shown strength every time at this key level.
Now price has broken above the falling resistance
The bulls need to hold above the breakout zone. .
Manage your levels accordingly.

DASHUSDT | Bulls Assemble?DASHUSDT has been holding horizontal level of 39 for a very long time now. We have seen 5 attempts but bears are unable to break it.
We expect price to break from here now. The only thing required is breakout from falling resistance and RSI should break above neutral zone.
How do you see DASH in coming days?

