DASH / USDT Price Outlook 06 May 2021Here is the chart for DASH / USDT . It is nice opportunity to have x2-3 profits on this pair, cause price still have room for growth during current alt-szn. Take a look at True Williams Alligator -- price following its moving averages and they acting like support during bull runs.
According to this I will expect further rise of dash during this year.
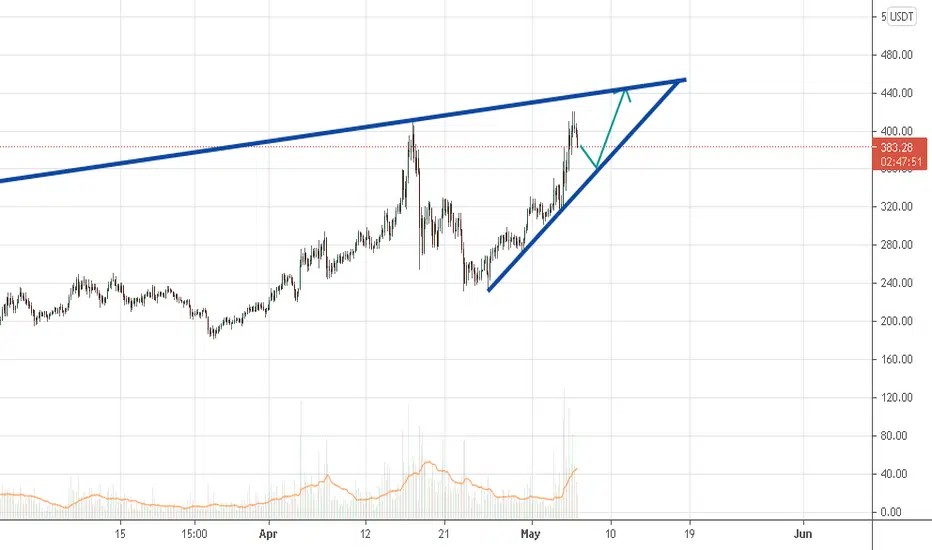
DASHUSDT trade ideas

DASHUSD: Where could be an entry or re-entry zone?Hello my friends!
Dash represents a good and fast payment technology. It is also one of my favorites. Currently, there are good entry and re-entry zones. The B zone seems to me to be the most likely. If the price falls below 181, a correction at around 100 is possible. However, that seems unlikely to me.
--
Let's see what happens.
Happy trading. :-)
--
second view:

The DASH DASHUSD Road Towards the Megabull - Up to 5,000% GainsHey guys!
I got couple of days of free time to continue publishing free long-term charts for ALTSCOINs, so hit that Like and Follow buttons to receive the latest notifications about my updates. Anyways, now lets get started!
This simple comparison seeks to compare the Megabull of 2017 against the current 2021 Megabull as seen as a potential/approximate green path we may follow in this round towards the final ATH. The idea here is pretty straightforward, on the long-term log scale charts, any asset or stock will be bound most of the time within a parallel bull channel. Similarly, I believe the bottom of the bull parallel channel has been well defined through the years, hence the top of the channel should give us a good idea of the ATH targets.
Short-term, DASH has still not broken the previous ATH at $1,600~ so buying know at $400 is still considered an early entry!
In the incoming weeks, I would expect DASH to start defining a short-term bull parallel channel or ascending channel which will be the road to either the $10,000 first Megabull target or the second Megabull target at $18,000-20,000 around Nov-Dec 2021.
Summary of the Megabull / Bull Market Targets by Oct-Dec 2021:
$8,000-10,000 (2,500% gains possible)
$18,000-20,000 (5,000% gains possible)
Looking ahead at the next bear market, we can expect the final bottom to shape a nice rounding bottom at $1,200-1,900 on DASH!
Bottom line, if you purchase DASH close to the $400 levels, you still can make between 2,500 to 5,000% in gains if this trade plays out as expected.
Best of luck and happy trading!
Carl M.

DASH USDT support and resistance#DASH #DASHUSD #DASHUSDT #binance #trading #cryptocurrency
I was expecting another general price correction.
But some coins have reached a point where there is no resistance.
And that's why growth has accelerated.
It may DASH have the same process, so be careful to re-enter the right places.
The best guide : If DASHBTC crosses 0.0088 , it will definitely climb to 0.015 and even higher.


Afternoon Londoners - Morning new Yorkers #crypto update 5.5.21#btc
#bitcoin
#daveportnoy
#orchid
#ada
#dot
#doge
#link
#eth


dashusdtGiven the specified channel, now it has hit the channel ceiling and the resistance range, we expect the midline range


MOVE UP after break the trend lineResistance on the way to DASH has made it difficult to cross and climb. But we hope that after breaking the minor trend line and stabilizing on top of it, it will climb to the desired TARGET


DASH/USDT 440$?Good day friends! 🤞😊Dash Coin Analysis.
I hope you understand what I'm talking about, because I don't know English , but I would like to share my thoughts with you !:)
At the moment, the coin is at the bottom of the channel ,if we have enough strength from the current ones, we will see an increase to 338 or with a pullback to the lower border, for the potential formation of a double bottom.
This is also indicated by the pair to bitcoin , where the formation of an ascending triangle occurs.
Target sale 338,390,440.
the cancellation of the scenario will be going beyond the lower border of the channel and fixing below the level of 243,in this case, from the rectangle marked in red on the chart, you can expect a strong reaction and a reversal of the trend.
If you liked this idea, put 👍, write what you think about this analytics in the comments, subscribe ✔, thank you for your attention.🔥😉

Bad scenario test weekly or monthly support ?Bad scenario: #DASHUSDT #dash #dashusd #binance #altcoin #crypto
Monthly support point test
Monthly : I can't believe this is happening right now!
This is just the monthly support point that the charts and indicators show. And there is no reason why it should be tested.
weekly : There is probably still weekly support re-testing.
$ 260-280 area
But now the chances of other scenarios (ascending and bullish scenarios) are higher.
What do you think ?

And the surprise scenario For DASH lazy coin#dash #dashusdt #dashusd #binace #cryptocurrency #altcoin #topcoins #best_altcoins #trading
Third scenario for dashusdt:
the surprise scenario for DASH (the lazy coin) growing in short term and Shock everyone

DASHUSDT - Long - Potential 12.00%DASHUSDT - Long - Potential 12.00%
Exchanges: Binance Futures
Signal Type: Regular (Long)
Leverage: Isolated (1X)
Entry Zone:
326.90 - 339.18
Take-Profit Targets:
1) 352.64
2) 381.19
Stop Targets:
1) 306.75
Trailing Configuration:
Entry: Percentage (0.0%)

DASHUSDT 2 target forecasts#bullish #dash# dashcoin #dashbtc #crypto #binance #buy_signal #altcoin #cryptocurrency #trade #dashusd
#forecasts
#DASHUSDT 2 target
about 600 / 880
I'm not sure about the timing, it's just a scenario
But I'm pretty sure about the targets

New HOPE?!🔥New week, New trade, folks🔥
Wake up to make money.
There is a Flag formation on DASH/USDT crypto pair.
Price had strong bullish sentiment before this consolidation.
Price bounced from support and resistance zones multiple times into this consolidation.
Then it had bullish breakout.
Possible retest is expected. However price increase without any retests.
So follow the chart and look for the best price to enter carefulyy.
_____________________________________________________
If you enjoy my FREE Analysis , support the idea with a big LIKE👍 and don't forget to SUBSCRIBE my channel, you won't miss anything!
Feel free to leave comments✉️
And always remember: "we don't predict, we react".


