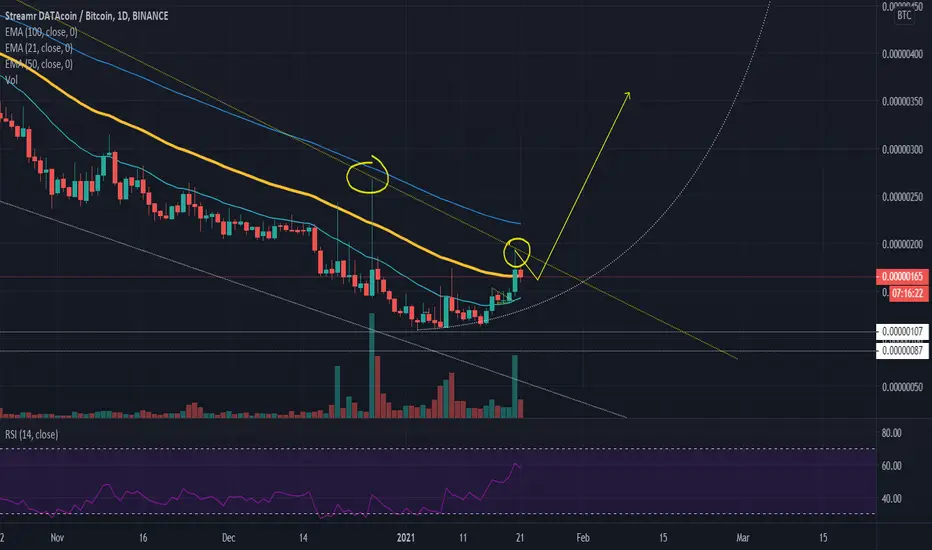
Streamr DATAcoin (DATA) Bullish Signals + 650% Target MappedDATABTC (Streamr DATAcoin) has been going through bullish consolidation where we see prices going sideways but slowly climbing up.
We saw a close above EMA10 recently and today we move above EMA21, which is positive.
The MACD is showing a bullish cross and the RSI is trending higher.
I am mapping here 650%+ as the potential for profits.
A more conservative target is set at 285% or 0.00000908... You still need your own plan/strategy before you trade.
Thanks a lot for reading.
This is not financial advice.
Namaste.
DATABTC trade ideas


DATABTC - Long - Potential 10.86%DATABTC - Long - Potential 10.86%
Entry- 205
TP1- 218
TP2- 227
SL- 193
- Trigger - Pullback
- BTC - Stabilising
- RR - 1.9
- Trailing Buy - 1%
- Trailing Profit - 1%
- Trailing Stop-Loss - no

DATA is trying to break up here...great R:R hereThis is not a financial advice. Always do your own research and always put stoploss in your trade (SL) :) If you want more detailed info how to study and read charts or just need help with some coin, just write to me here personal message, i will try to answer to everybody... i can help you :) all for free, don't worry, BE HAPPY!
If u like the analysis, please feel free to ask any question about this TA or crypto or any coin and also leave a comment or like, i really appreciate it because then my work makes sense :) thanks!

DATABTC - Long - Potential 15.44%DATABTC - Long - Potential 15.44%
Entry- 182
TP1- 192
TP2- 210
SL- 169
- Trigger - Pullback
- BTC - Price Rising - Alts rising
- RR - 2.2
- Trailing Buy - 1%
- Trailing Profit - 1%
- Trailing Stop-Loss - no

Nice Buy Opportunity ❕ Impulsive Correction Completed ,Sitting Above The Strong Support At 140 Sat ,Nice Buy Opportunity
✅ Targets On The Chart
🔴 Stop loss zone : 143 ~ 140

DATA/BTC Ready with 800% Bullish potentialDATA/BTC
Current Price = 0.00000192
TP 1 = 0.00000360
TP 2 = 0.00000580
TP 3 = 0.00000815
TP 4 = 0.00001085
Stop Loss = 0.00000075
Tenure = 60 to 120 Days
Bullish Potential = 800%
Technical Analysis
1. DATA recently breaks its falling wedge
2. Now it trading above 100EMA And 200EMA
3. Golden Cross (50EMA Cross up 200EMA)
4. Revesal from All Time Low too
5. Trading above 50 at RSI(14)
6. Breaks out bullish pennant
You can take entry in this project for long term for a very good profit.
Thanks & Happy Trading

Data/BtcData is in a critical situation and due to its new fluctuations as well as the upward trend of the market, it seems that it will be able to return to the previous price.
Watch his 200 SMA in daily time frame

DATA: this is probably not overDATA is stabilizing on the 4Hours chart. I expect the pump to continue and new highs to be reached.


DataBtc Huge Buy opportunityHello friends,
Data breakout of this massive falling wedge setup. The chart is clean and explanatory on what to do on it. Enjoy it guys
Kindly follow the suggested BUY zone on the chart and always remember to apply stop loss according to the chart and your personal set risk management.
Level to watch for are:
POSSIBLE ENTRY ZONE
Possible Support LEVEL
SELL TARGETS
Kindly go through the chart and leave us your comments with your likes and also follow us for more trading updates.
Thank you.
Note:
It will be good to always understand risk involve in trading. Always trade with stop Loss in place.
Set up an entry/exit strategy for every trade, with good risk/reward ratio.


DATA , just on time !you wanna cheap coin ? here you are lol , as you can see price broke daily trendline , weekly reacted to support and rsi turning bullish , im gonna buy small bag

IS ROCKET READY? % 900-1000 PROFIT POTENTIALI think that legend will back again.
important note: it is not investment advice.
full respect,

Trend Reversal1) EMA 50 x EMA 200 crossed
2) 280 days downtrend breakout
3) Pennant breakout
Target: 275 sats

DATAYOUR LIKE OR COMMENT IS MY FUEL FOR NEXT ANALYSIS :)
This is not a financial advice. Always do your own research and always put stoploss in your trade (SL) :) If you want more detailed info how to study and read charts or just need help with some coin, just write to me here a comment, i will try to answer to everybody... i can help you :) all for free, don't worry, BE HAPPY!
If u like the analysis, please feel free to ask any question about this TA or crypto or any coin - leave a comment or like or share the idea, i really appreciate it because then my work makes sense :) thanks!

Elliott Waves working on 4h chartWe could see the first elliott wave completed!
The top chart's blue line is a big resistance (275 days downtrend).
If we see this channell broking, I expect a BIG MOVEMENT (second Elliott Wave). Keep your eye open.
DATA is near to trend reversal (bearish to bullish).

DATABTC should be the next (+800%)DATABTC is silently breaking its long term downtrend and it is one of the coins that has not pumped yet.
Such a low traded coin can pump easily and very fast. So don't miss out

DATA is ready to startbuy : under 150 to 100 satoshi, above support line
sell target :
A. 1200
B. 1700
C. 2300
Best Regards
