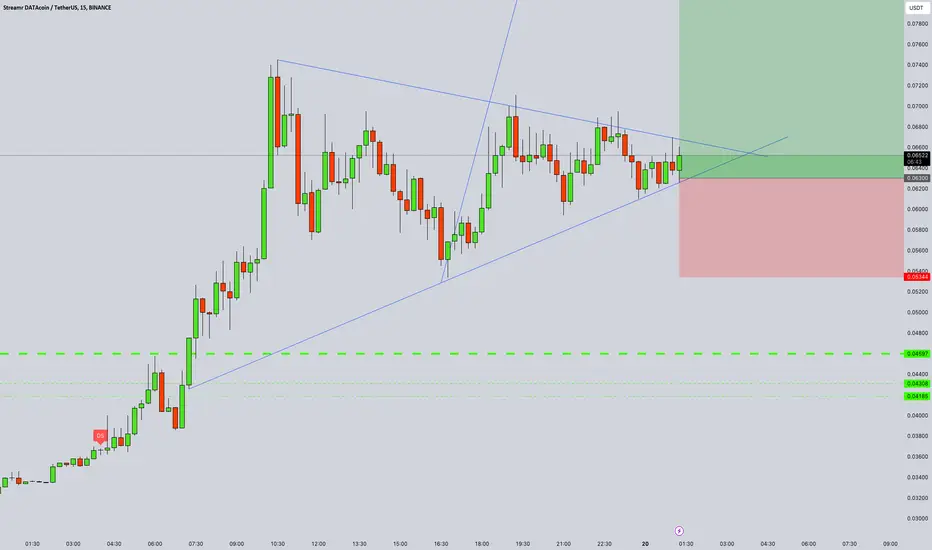
DATA Spot Opportunity Data spot Opportunity.
I will buy after breakout and retest.
If will price drop to green trendline then I will buy more
DATAUSDT trade ideas

DATA/USDT Swing SignalDATA/USDT Swing Signal
Invest 25% of your trading portfolio.
Targets are:
0.05151
0.05251
0.05454
0.05556
SL: 0.04500

DATA/USDT Strong Impulsive Wave Is ComingHello everyone.
There is one last impulsive wave is expected on DATA before deep correction.
Expected target (0.11 - 0.12) $.
Best luck

DATAUSDT.4HBased on the provided market data, the cryptocurrency DATA is currently priced at $0.045 against USDT. The Relative Strength Index (RSI) over 4 hours, 1 day and 7 days are 31.83, 45.62 and 66.27 respectively. The RSI values suggest that the asset is currently in a neutral zone, neither being overbought nor oversold.
The Moving Average Convergence Divergence (MACD) for the same periods are -0.0013, 0.00079 and 0.0055 respectively. The negative MACD on the 4-hour chart might indicate a bearish signal, however, the positive MACD on the daily and weekly charts may suggest a bullish trend in the longer term.
The Bollinger Bands (BB) are at 0.054, 0.056, and 0.056 for the 4-hour, daily, and weekly periods respectively. The current price is below the middle band in all periods, suggesting a potential upward movement towards the band.
The support levels are at 0.041 (4-hour and 1-day) and 0.029 (7-day). The resistance levels are at 0.050 (4-hour), 0.057 (1-day), and 0.054 (7-day). These levels will be crucial to watch as they could indicate potential reversals or breakthroughs.
In conclusion, the market data suggests a mixed signal with short term bearish and long term bullish trends. It's important to consider other market factors and your personal risk tolerance when making investment decisions. This analysis is purely based on the provided data and does not constitute financial advice.

DATA (Streamr) is ready for a massive pump (2811%)DATA is starting something really huge. We can see that whales accumulated for a long time and now the price is breaking out of the accumulation phase. If we take a look at the volume indicator, we can see that the volume is astonishing. This definitely confirm our bullish bias. 2811% profit is not a sci-fi, but a real deal. Elliott Wave ABC corrective pattern is complete. Let me know what you think about my analysis, and please hit boost and follow for more ideas. Thank you, and I wish you successful trades!
Streamr (DATA) is a project focused on seamless data exchange and monetization of this data. It’s a peer-to-peer (P2P) network for real-time data that runs on Ethereum, allowing smart contracts to be used to facilitate the exchange process.
Broker nodes are the key element of the network, which work as follows: data is received from providers (also called publishers) and transmitted to consumers – this is the publish/subscribe pattern that the network uses. Sponsors (which may be publishers) pay DATA tokens into a smart contract (called a Bounty) to secure the operation of the stream. The data stream is secured by broker nodes mining Bounties, and relayed to subscribers through publisher or broker nodes (data streams are segmented).
A number of technologies that have been developed to optimize Streamr are a hierarchically organized complex called the Streamr Stack. This complex supports uninterrupted data transmission in the Streamr network and consists of five blocks: smart contracts (responsible for optimizing relations between participants in the network's information market); streamr editor (a set of programming tools developed for the purpose of the project); streamr engine (responsible for analyzing, processing, refining data and monitoring network events); data market (a center for data streams and a platform where data is transmitted and received); streamr network (used to transfer data). Let me know what you think about my analysis, and please hit boost and follow for more ideas. Thank you, and I wish you successful trades!

DATADATA has reacted to the 4 hour orderblock below and found resistance on the 4 hour above. It is possible a trading range is developing for short time creating relative equal lows and equal highs which is opportunity for the "big"traders' to retail traders margins and stoplosses. Its a scenario that the orderblock at the strong low/protected low will be visited, retested as it the block that caused the pump. Once visited heading to the major high. Opportunity for long at the lowest orderblock.

DATA!!!!Feeling lucky 😊😀😊
It's absolutely not recommended to trade based on emotions according to education and knowledge
What do they know 🤔
Not financial advice 😭
Peace 🕊️🕊️🕊️

DATAUSDT.PDATAUSDT.P is in bullish trend.
Printing HH and HL.
No sign of reversal here.
WE buy at CMP .

DATAUSDT.PDATAUSDT.P is in bearish trend.
Potentially printing LH and LL.
Bearish divergence also shown in RSI.
We wait and watch for the breakout of last LL.

DATAUSDT.4HBased on the provided market data, the currency DATA is currently trading at $0.049 against USDT.
Looking at the 4-hour chart, the Relative Strength Index (RSI) stands at 53.02, which is neutral, indicating that the asset is neither overbought nor oversold. The MACD is positive at 0.0028, suggesting a bullish momentum. However, the price is below the Bollinger Band's middle line of 0.069, indicating a bearish trend. The immediate support levels are at 0.048, 0.040, and 0.033, while the resistance levels are at 0.054, 0.069, and 0.075.
On the daily chart, the RSI is at 62.22, indicating a slightly bullish sentiment. The MACD is also positive at 0.0027, suggesting bullish momentum. The price is below the middle line of the Bollinger Bands, indicating a bearish trend. The support levels on the daily chart are at 0.051, 0.038, and 0.028, with resistance levels at 0.061, 0.072, and 0.076.
On the weekly chart, the RSI is at 73.25, indicating overbought conditions and a potential for price correction. The MACD is positive at 0.0056, indicating a strong bullish momentum. The price is slightly above the middle line of the Bollinger Bands, indicating a bullish trend. The support levels are at 0.038, 0.029, and 0.020, with resistance levels at 0.067, 0.073, and 0.1061.
In conclusion, while there are bullish signals from the MACD on all three timeframes, the RSI on the 7-day chart indicates overbought conditions which could potentially lead to a price correction. Meanwhile, the price being below the Bollinger Bands middle line on the 4-hour and daily charts indicate a bearish trend. Traders should keep an eye on these indicators and act accordingly. As always, it's important to consider other market factors and your risk tolerance before making investment decisions.

Trade in reverse zone (DATA)❤️❤️Thanks for boosting 🚀 and supporting us!
📈we have in any trend position just wait for come to zone.
Buy : 0.548
sell : 0.1062
🔴 Stop Loss :
Buy : 0.0471
sell : 0.11218
🎯 Take Profit : 0.0631-0.0714-0.0814-0.0921-0.1063-0.111
🔗 For more communication with us, In the footnote and send a message in TradingView.
👨🎓 Experience and Education: Our trading team has five years of experience in financial markets, especially cryptocurrencies.

DATAUSDT - BULLISH OUTLOOKDATAUSDT is exhibiting a bullish trend on the Daily Time Frame, indicating a potential bullish continuation. The presence of a bullish divergence on the 1-hour time frame adds further confirmation to this positive outlook.
For potential entry, consider a price zone between $0.5840 and $0.5360, with a stop loss set at $0.4940 to effectively manage risk.
Take-profit levels are structured as follows:
Take Profit 1 (TP1): = $0.6740
Take Profit 2 (TP2): = $0.7640
Take Profit 3 (TP3): = $0.8540
Take Profit 4 (TP4): = $0.9440
This trade setup incorporates structured profit-taking at different levels, while the stop loss acts as a risk management measure. Keep in mind that market conditions may evolve, so monitoring price action and adjusting strategies accordingly is advisable.

DATA/USDTI've conducted a short-term analysis on DATAUSDT, and it seems to be displaying a bullish trend. The current stop position surpasses the accepted level, indicating a proportionately larger target. It's essential to clarify that this is not financial advice but rather my observation of the short-term patterns in DATAUSDT.
DATAUSDT (Streamr) Daily tf Range Updated till 19-12-23DATAUSDT (Streamr) Daily timeframe range. over 120%+ pump within a day. thats some impressive move made nice gains there for myself. 0.06824 hold up for now range level gaps are big in this one cause of price action. if can pass clean here next level till 0.09355.

#Data#Data
The market has formed a falling wedge pattern and is currently testing trend line resistance. A breakout above resistance could signal a bullish reversal, with potential gains of 120% or more.

DATA Streamr Coin Price Prediction🔥 Price on the 4H chart might come at these support area and we might get a potential bounce🔥
Potential bounce areas for Buying 0.05510 and 0.04706
👉 Follow me for more real time opportunities.
Share your Thoughts if you have any?

DATA cup and handle on the Daily Time FrameDATA on Kucoin - this is the Daily time frame
cup and handle
with targets on chart
💥 Market Cap of 28.8M
👉 Remember low market caps are easy to move and
recommended to have multiple targets ( depending on the
amount you put in )
This is for ENTERTAINMENT purpose Only.
Not Financial Advise
Always DYOR ( do your own research )

$DATA above 200 ema on daily
looks to be breaking out of range
volume influx and we boom
raised stop to under 200 ema

DATAUSDT - BULLISH OUTLOOKThe technical analysis for DATAUSDT suggests a bullish trend based on price action, further supported by a bullish divergence. The uptrend is characterized by higher highs and higher lows, indicating a robust upward momentum. The absence of any RSI bearish divergence adds to the positive outlook, potentially signaling a continuation of the bullish trend.
Here's a potential trading plan based on the provided analysis:
Entry: Consider entering a long position at $0.02872.
Stop Loss (SL): Set the stop loss at $0.02500 to manage potential downside risk.
For take-profit (TP) levels, you have three options based on different risk-reward ratios:
TP 1:1 = $0.03244.
TP 1:2 = $0.03616.
TP 1:3 = $0.03988.
This trade plan is designed to capitalize on the current bullish momentum and the positive signals from the RSI divergence while managing risk through the placement of a stop loss. Remember that all trading involves inherent risks, so it's essential to stay informed, monitor the trade closely, and adjust your strategy as needed based on market developments

DATAUSDT - BULLISH OUTLOOKThe technical analysis for DATAUSDT indicates a bullish trend based on price action. The consistent pattern of higher highs and higher lows suggests a robust uptrend, and the absence of any RSI bearish divergence adds to the positive outlook.
Here's a potential trading plan based on the provided analysis:
Entry: Consider entering a long position at $0.02875
Stop Loss (SL): Set the stop loss at $0.02500 to manage potential downside risk.
For take-profit (TP) levels, you have three options based on different risk-reward ratios
TP 1:1 = $0.03250
TP 1:2 = $0.03625
TP 1:3 = $0.04000
This trade plan is designed to capitalize on the current bullish momentum while managing risk through the placement of a stop loss. However, it's crucial to bear in mind that trading involves inherent risks, and market conditions can change. Stay informed, monitor the trade, and adjust your strategy as needed based on evolving market dynamics

100% Potential!DO NOT FORGET USING A STOP LOSS
Warning:
This is just a suggestion and we do not guarantee profits. We advise you analyze the chart before opening any position.
I hope you are always profitable

DATA LOOKS BEARISHHi, dear traders. how are you ? Today we have a viewpoint to SELL/SHORT the DATA symbol.
For risk management, please don't forget stop loss and capital management
When we reach the first target, save some profit and then change the stop to entry
Comment if you have any questions
Thank You

DATAUSDT LONG OPPORTUNITYSignal: Blue -> Green * N
Double Bottom structure
Risk Reward: 2
DISCLAIMER
This is only a personal opinion and does NOT serve as investing NOR trading advice.
Please make your own decisions and be responsible for your own investing and trading Activities
