DCRBTC trade ideas


Exciting Decred updates - 100%+ profit projectionWith several exciting updates already lately from Decred such as atomic swaps, new exchange listings and upcoming ASIC support there seems to be an interesting future ahead for Decred. Especially considering Lightning Network support is on track will be released 'very soon' (Q4 2017 according to their roadmap). Ontop of all this the circulating supply of Decred has been decreasing due to people locking their coins up in PoS for staking rewards, which is something that will definitely be reflected on the price per Decred.
All in all, I don't see any reason not to buy Decred! However, I am nowhere near being an experienced trader so please always do your own research for your investments/trades.
Source: thedecreddigest.com

DECRED MY LOVE FINALLY GOING FOR THE MOON they have a lot of fuel to go to moon, happy staking guys!

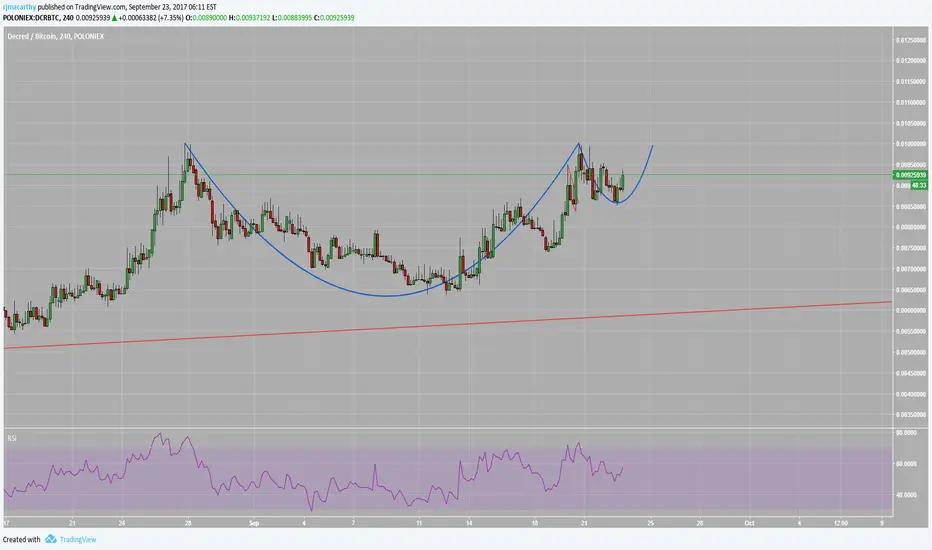
My First Trend line alert test on DCR/BTCpractice at alerts & publishing ideas
using two trend lines one to alert and one to trigger a buy
testing testing 1...2...3....major lee!
:)

Any crypto cannot be better than DCRnews : atomic swap DCR <-> BTC
technical analysis
: Other than this indication, According to my additional analysis, DCR is now trying to above neutral stage, meaning that it starts to sit on the launchpad.
Some possibilities - It could be flare again to revive altcoin market just like Jan. 2017. (Check DCR chart in 2017 Jan through late spring.)
recommend this coin as hodl coin throughout 4Q, as long as it's uptrend will be broken.


DCR in a good accumulation zoneDCR has been praised by many as well as having an amazing governance model and solid team. We really need to look at this Bitcoin rise as a blessing for giving us optimal entries for certain alts in the future. Decred is approaching the classic 0.883 retracement as well as very likely to respect a prior top from February as shown in the chart. Any price here or below will be amazing entries once we begin to look in hindsight and I would consider to begin to build longs here as ultimate bottoms are impossible to predict due to liquidity issues as well as no one can tell how strong the emotions people will feel here as they continue to sell here for massive losses. Crypto is a game of deception and if they continue to fill orders here or below, count your blessings and take it, just continue to average yourself in micro-buys and buy people's fear.


High Pivot on DCRBTCIf there is a break in the High Pivot by 0.006467, the currency will start a bullish trend, with one of the future targets being the 0.01 mark, or 54.6% gain.


wedge in a flagdecred seems to have entered in a downward channel or flag which also contains a long-tail falling wedge. once after the wedge gets broken, we can start looking for an upward movement out of the channel but until then, I expect it to steadily fall down.

DCR the failed golden childOnce again the same classic crypto story being told here. DCR was praised by many, including Charlie Lee as being the Golden child of crypto with its "governance". The market doesn't care, it just wants to make money and that can only happen with loss. DCR is bleeding out as people fight the trend, expect it to go into the prior consolidation belt, which once again is the 0.883 classic crypto retracement. These markets are just too predictable at this point...


DECRED POISED FOR LIFT-OFF || IDEAL HOLD FOR Q4 2017$DCRBTC is in the ideal position to set up buy-orders. Has finished correcting and now we just wait.

Bullish Gartley - Good entry for DCRBitcoins rally pushed DCR further down below its original support, this is a great buy in as RSI is oversold and a bullish gartley has formed.
Place adequate stop loss as indicated, and take profit at top of previous resistance.


Decred still bearish for short termDecred dropped below the cloud, breaking the smaller upward trend (yelllow-dot line) and is now heading to the bottom of the main bullish trend channel.
Signals for a drop are:
1. Price is below the cloud
2. Conversion line dropped below base line
3. MACD is pointing downwards
RSI signals a highly oversold market.

DCRBTC Poloniex. Forming a resistance lineAccording to the news fund, this asset has the potential to continue to grow, but the market suffers a large correction, from which this line forms a resistance line. There are all chances to break this line, and continue the growth to the levels indicated on the chart

A nice hot cup of DCR - Long hold through Q4 2017DCR loves cup and handle pattern.
Watch this closely, next target 0.0125.
On non technical note - check roadmap and latest blog posts. DCR is ahead of the curve in many ways. A long hold through Q4 2017 will show great returns on this coin.
blog.decred.org
long on #1 coin in governance DCRAscending triangle - should be near the bottom of the channel depending on which one plays out : Higher lows + flat top. Had highest close today with H printing on volume for significant volume. Might get another low, might not, but I added to my long on the pullback after the high. Top of channel should be around $40 near S4 on monthly as ultimate target. This would be wave 5 as we already had 2 impulses up.
Fundamentals:
Market cap is only 87m for a very well respected proof of activity coin based on concept by litecoin lead dev - plenty of upward room left. Here the litoshi introducing them for their speech - www.youtube.com
I would estimate the ideal market cap for this coin at this point around 200-400 m if the next few major votes and forks the votes enforce on protocol level go off without a hitch
roadmap for this year is nuts: Lightning network + segwit, voting, staking, smart contracts, unknown privacy method (fingers crossed for mimblewimble) blog.decred.org
Tezos ICO and announcement of EOS this month as well as eth dev centralization issues and btc/ltc issues with miners is bringing attention to experimental governance coins, especially DCR I think, but also lesser known ones like bitshares/steem that innovated on the dpos scheme. However in no existing coins is the governance as built in to prevent lead developers from having too much power and going against community like with eth self-bailout disaster, but also to allow innovation to occur securely to avoid miners with too much power.
I used to hate lock up periods for any coins PoS staking, but after listening to interview with dan larimer he explained it's done that way to prevent people from buying tokens just to destroy a cryptocurrency, as they would have to stick around and suffer the consequences of their voting financially. 1 month or so lock up for voting tickets now seems more reasonable to me.
This is a very exciting project to me personally. Long term with well done governance and checks and balances, you can build enormous amount of complexity on a solid foundation like this.

Thinking the price will retrace some Hoping it drops down to where i called my buy in a few days ago. Against 200 ma. If it pops through the 200 ma ill buy.
