Decred/Bitcoin potential daily bull div Nearing decision point for Decred. Not going to look good if it goes below .003, but decent set up to buy support with a daily div like this for now.
DCRBTC trade ideas


DCR DecredBTC IS Ready For Breakout Above Aprils High 50% PPBINANCE:DCRBTC Is showing strong momentum and Increased
RSI
Buying Volume
DCR is ready to breakout with 50% Profit Potential from Now the green candle pattern has already formed and we already have broken April's low now its time to watch the show for Bull run.
About the Chart
I have highlighted 3 Targets using 3 different color of lines and giving 2 of them names like A and B whilst i have also highlighted the possible drop-zone in case of not being able to find desired support .The resistance is marked with black 2 faced arrow.
we still need some more volume to hit 5700
I hope you liked this chart.
i will keep you guys updated .
Never forget to use stop loss.
Sometimes you earn the other times you learn.
Never put all your Money in one bag .
happy trading

DCR/BTC What Now???Hello Friends,
Right off I just want to say that I am not into this trade but have decided to do this chart for those who seem stuck within this shit coin.
So here we are, what is the next move? Well it surely hasn't been looking good since that last blast off with the spurring of the divergence seen on this chart. Is there light at the end of the tunnel? It really is hard to say, which is why I present two scenarios here. It is clear that the pattern here presents a contractring triangle and has completed its ABCDE cycle.
Now is the critical moment of where it will go. Because of the bearishness of this coin it could easily go south. However the bright side is, RSI is in a buy zone and take note of the rounded bottom that has been created, highlighted with a parabolic green line. The fractal gives a current buy signal but could change in a day or two. Take note that the MACD and RSI are on an incline since it lowest point and there has been a bit of a shift in higher lows since the latest spike. Honestly it is really difficult to determine if this is a bearish triangle or bullish, thus the two scenarios are here for you to watch which way it plays out.
Details on the chart.
This is my viewpoint and my opinion. I am not giving advice but only sharing what I see. Do not enter a trade on my TA but do your own homework.
Cryptocurrency is volatile and very risky. Never invest what you can't afford to lose and always educate yourself and continue to do so when making any kind of investment.
If you find this information helpful, then please hit the like button . Your support is appreciated. Thank you!
CYA on the next one...until then, the trend is your friend. Buying on the dip and selling on the hype.
Cheers!


$DCR Potential Ascending Triangle in formation...$DCR Potential Ascending Triangle in formation...
UCTS Buy signal active
Volume slowly rising
Sitting over EMA50/100, breaking above ~4919 w volume is key
RSI rising, MACD flat
Bullish Wolfe wave on the 12h
Target on the chart... Falling below ascending trendline cancels it.
#DCR


DCR LONGbest time
RSI perfect
for buy
in :4271~4400
target 1 : 4540
target 2 : 4705
target 3 : 4850
target 4 : 4957
target 5 : 5065
target 6 : 5200

Decred / BTC Long DCR is a solid shillcoin with fundamentals from the likes of Rhett. Plenty of PR from Developers.
DCR has fallen despite BTC's pump. I believe if BTC stabilizes, DCR will soon catch up.
The rsi is oversold on the 4hr time frame w/ divergence between price action and RSI, as well as on a 10 count with TD Sequential indicators.
I'm looking for my target to be hit within 5 days.
While I could probably hold out for 40 satoshis more before stepping in, I'm starting a buy at 4390.
I'm looking to cut past 4300.
My 1st target is about 4600 for a 4% gain. A little more than a 2:1 set up.

Decred ($DCR) - up to 369% PPT! Long term trade.$DCR shows bullish divergence on daily MACD.
It's in accumulation phase as the most of the market.
Green - buy. Red - sell.
It's not a financial advice.
Trade carefully and good luck!

DCR (Binance) Mid it show trend up again waiting to breakoutFor mid to short
i see trend going up
using Fibo i hope we can get good price in area 0.68

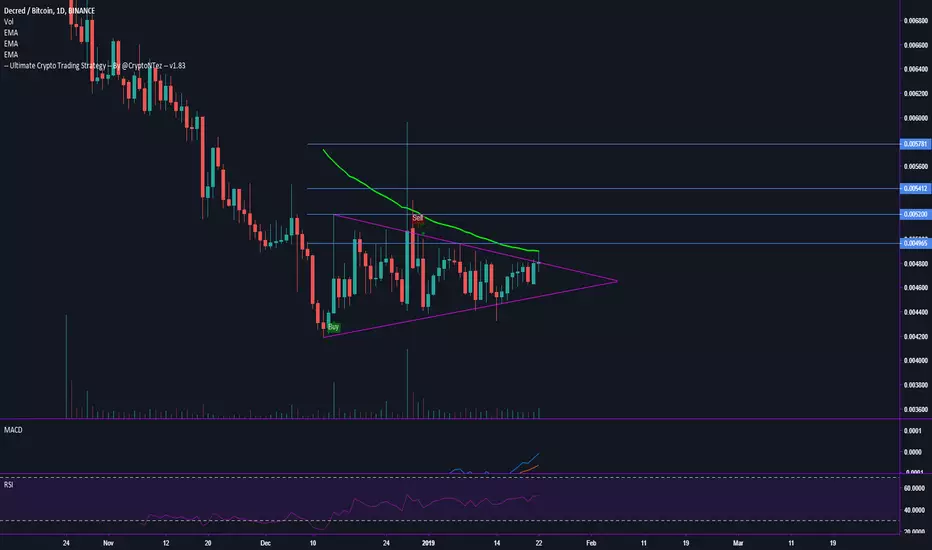
Testing the Symmetrical Triangle$DCR Testing the upper trendline of the symmetrical triangle that we charted some days ago.
Touched EMA200 on the 6h chart & bounced back, but we are still on a Buy Signal from the UCTS. MACD and RSI are OK.
Set alerts around 4965sats and wait for bigger volume confirmation #DCR

DCRBTCAbout to cross thee 200 ema Buy in at blue line / green box, for breakout!
This is not trading advice, these are my Ideas only, I'm not a trading adviser.


DCR Trend Break A nice break out of the triangle today. It spent some time consolidating in the middle before going for the break.

Tezos xtz dcr ethYou can use other exchanges for each coin and certain tops/bottoms for fibs. you get the idea.
Some ppl hate fractals, Manson, im looking at you.
Other ppl keep buying on the parabolic down/fib targets and waiting/praying.
You choose.
when i get more btc, xtz will be one of the coins ill be buying in 'bits' when i can.
