Smooth BUY and SELL on DCR / 1 indicatorBuy Green
Sell Red
//
it's mainly for swing trading, i use the 3 day / 15 day / monthly charts with it and it works perfectly,
//
it works good for stocks and cryptocurrency.
//
you will use heiken ashi chart style and turn on the EMA DOTS indicator.
once the indicator is on you will hide the heiken ashi so you only see the dots.
//
when a green dot -6.68% -7.44% -7.44% appears you buy, if a green dot -6.68% -7.44% -7.44% appears after that green dot -6.68% -7.44% -7.44% you hold your investment.
if a red dot appears you sell your position. easy as that.
//
the standard dots setting will be set to 10 - use this for any chart above 3 days
change the dots setting to 6 for 3day charts and below
//
shorter time frames will be choppy.
//
larger time frames will be smooth.
//
*Daytrading smaller timeframes is possible but not recommended.
DCRUSD trade ideas

Decred Ascent. Been looking at Decred more lately. Recently leaped above the 200 ema. Establishing a run upwards. Love trading between LTC and DCR positions. Trading pair potential.

There is a trading opportunity to buy in DCRUSDTechnical analysis:
. DECRED/USDollar is in a range bound and the beginning of uptrend is expected.
. The price is below the 21-Day WEMA which acts as a dynamic resistance.
. The RSI is at 47.
. The price downtrend in the daily chart is broken, so the probability of the resumption of an uptrend is increased.
Trading suggestion:
. There is a possibility of temporary retracement to suggested support zone (39.00 to 31.00). if so, traders can set orders based on Price Action and expect to reach short-term targets.
Beginning of entry zone (39.00)
Ending of entry zone (31.00)
Entry signal:
Signal to enter the market occurs when the price comes to " Buy zone " then forms one of the reversal patterns, whether " Bullish Engulfing ", " Hammer " or " Valley " in other words,
NO entry signal when the price comes to the zone BUT after any of the reversal patterns is formed in the zone.
To learn more about " Entry signal " and the special version of our " Price Action " strategy FOLLOW our lessons:
Take Profits:
TP1= @ 54.58
TP2= @ 58.52
TP3= @ 72.15
TP4= @ 83.18
TP5= @ 94.32
TP6= @ 110.07
TP7= @ 130.05
TP8= Free


Decred (DCR/USD) - Away and wait for new trendDecred has a good accumulation but I think this is not for it has new trend. DCR need lower bottom and accumulate in here for sometime before something will broke and happen with news.
Follow me for getting more analysis about Bitcoin - Altcoin - Stock - Forex - Index idea.

There is a possibility for the resumption of uptrend in DCRUSDTechnical analysis:
. DECRED/DOLLAR is in a downtrend and the resumption of an uptrend is expected.
. The price is below the 21-Day WEMA which acts as a dynamic resistance.
. The RSI is at 24.
. While the RSI and the price downtrend in the Daily chart are not broken, bearish wave in price would continue .
Trading suggestion:
. There is a possibility for the resumption of an uptrend in the suggested support zone (38.00 to 22.30). traders can set orders with entry signal based on Price Action and expect to reach short-term targets.
Beginning of entry zone (38.00)
Ending of entry zone (22.30)
Entry signal:
Signal to enter the market occurs when the price comes to "Buy zone" then forms one of the reversal patterns, whether "Bullish Engulfing" , "Hammer" or "Valley" in other words,
NO entry signal when the price comes to the zone BUT after any of the reversal patterns is formed in the zone.
To learn more about "Entry signal" and the special version of our "Price Action" strategy FOLLOW our lessons:
Take Profits:
TP1= @ 47.71
TP2= @ 54.58
TP3= @ 58.52
TP4= @ 72.15
TP5= @ 83.18
TP6= @ 94.32
TP7= @ 110.07
TP8= @ 130.05
TP9= @ Free

DCRUSD COMMENTSFrom the trends of gthe two EMAs (20) and (50), this seems to be a downtrend in price, The Resistance level also seems to be way above. It would not be advisable to enter this market until at least the 27th, if the EMA seem more favorable then. The Target Price seems to be an ambitious one for at least the next 2days.

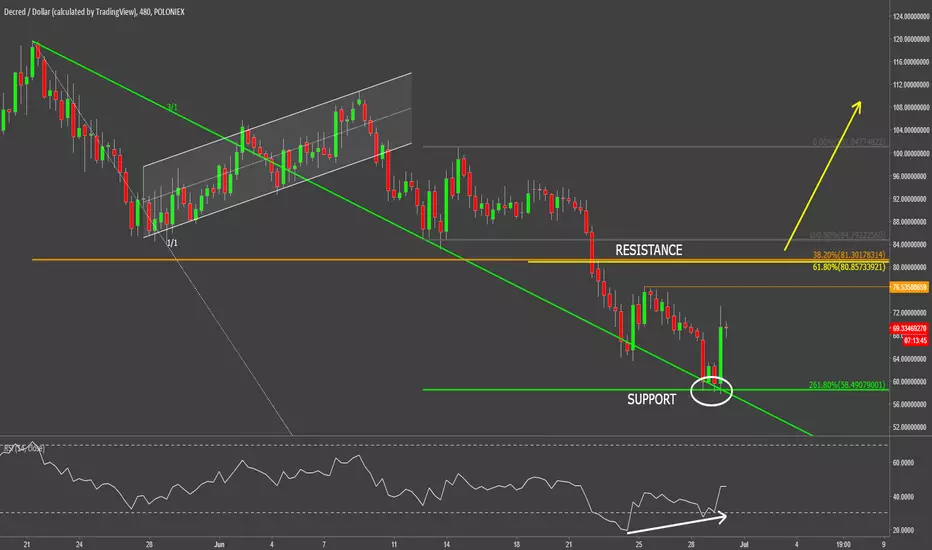
Decred Could Have Found The BottomToday Decred has rejected the $58.5 level, that is 261.8% Fibonacci retracement applied to the corrective wave up after the ascending channel breakout. Simultaneously, DCR/USD bounced off the 3/1 Gann Fan trendline which has acted as the support.
And finally, RSI formed a bullish divergence suggesting the potential trend reversal. If price stays above the $58 support it is very likely that the trend will change and Decred will eventually start producing higher highs.
At this point it is a very early stage of the trend reversal, which need more confirmations to say with confidence that the trend is now up. Therefore, it is important to watch for the $81 resistance level breakout as this could be a long waited trend reversal confirmation.


Decred , A good trading opportunity to buy in DCRUSDT echnical analysis:
DECRED/DOLLAR is in a down trend and Beginning of up trend is expected.
The price is below the 21-Day WEMA which acts as a dynamic resistance.
The RSI is at 36.
Trading suggestion:
*The price is in a down trend, but we forecast the uptrend would begin.
*There is possibility of temporary retracement to suggested support zone (36.90 to 22.30), if so, traders can set orders based on Price Action and expect to reach short-term targets.
Beginning of entry zone (36.90)
Ending of entry zone (22.30)
Entry signal:
Signal to enter the market occurs when the price comes to "Buy zone" then forms one of the reversal patterns, whether "Hammer" or "Trough" , in other words,
NO entry signal when the price comes to the zone BUT after any of reversal patterns is formed in the zone.
To learn more about "Entry signal" and special version of our "Price Action" strategy FOLLOW our lessons:
(We have started to prepare these lessons in TradingView. If you want us to continue, give us feedbacks!)
Take Profits:
TP1= @ 50.40
TP2= @ 65.70
TP3= @ 83.90
TP4= @ 99.50
TP5= @ 130.04
TP6= Free


TP5 hit with 85792505964 profit in 24 days. NEW Buy Opportunity.DECRED/DOLLAR
New trading suggestion:
*The price is in an up trend, and we forecast the uptrend would Continue.
*There is still possibility of temporary retracement to suggested support line (50.40) , if so, traders can set orders based on Price Action and expect to reach short-term targets.
Entry signal:
Signal to enter the market occurs when the price comes to "Buy zone" then forms one of the reversal patterns, whether "Hammer" or "Valley" , in other words,
NO entry signal when the price comes to the zone BUT after any of reversal patterns is formed in the zone.
To learn more about "Entry signal" and special version of our "Price Action" strategy FOLLOW our lessons:
Trade Setup:
We opened 6 BUY trade(s) @ 39.40758259(day close price) based on the reversal candle ( Hammer ) at 04.01.2018.
Total Profit: 85792505964
Closed trade(s): 8177725223 Profit
Open trade(s): 4014780741 Profit
Closed Profit:
TP1 @ 50.40 touched at 04.07.2018 with 1099241741 Profit.
TP2 @ 65.70 touched at 04.15.2018 with 2629241741 Profit.
TP3 @ 83.90 touched at 04.25.2018 with 4449241741 Profit.
TP4 @ 99.50 touched at 04.25.2018 with 6009241741 Profit.
TP5 @ 130.04 touched at 04.25.2018 with 9063241741 Profit.
1099241741 + 2629241741 + 4449241741 + 6009241741 + 9063241741= 8177725223
Open Profit:
Profit for one trade is 79.55539000(current price) -39.40758259(open price) = 4014780741
1 trade(s) still open, therefore total profit for open trade(s) is 4014780741 x 1 = 4014780741
All SLs moved to Break-even point.
Take Profits:
TP6= Free
Technical analysis:
Decred/Dollar is in an Up Trend and Continuation of up trend is expected.
The price is above the 21-Day WEMA which acts as a dynamic support.
The RSI is at 75.

TP5 hit with 13134175223 profit in 24 days. NEW Buy Opportunity.DECRED/DOLLAR
New trading suggestion:
*The price is in an up trend, and we forecast the uptrend would Continue.
*There is still possibility of temporary retracement to suggested support line (50.40) , if so, traders can set orders based on Price Action and expect to reach short-term targets.
Entry signal:
Signal to enter the market occurs when the price comes to "Buy zone" then forms one of the reversal patterns, whether "Hammer" or "Valley" , in other words,
NO entry signal when the price comes to the zone BUT after any of reversal patterns is formed in the zone.
To learn more about "Entry signal" and special version of our "Price Action" strategy FOLLOW our lessons:
Trade Setup:
We opened 6 BUY trade(s) @ 39.40758259(day close price) based on the reversal candle ( Hammer ) at 04.01.2018.
Total Profit: 13134175223
Closed trade(s): 8177725223 Profit
Open trade(s): 4956450000 Profit
Closed Profit:
TP1 @ 50.40 touched at 04.07.2018 with 1099241741 Profit.
TP2 @ 65.70 touched at 04.15.2018 with 2629241741 Profit.
TP3 @ 83.90 touched at 04.25.2018 with 4449241741 Profit.
TP4 @ 99.50 touched at 04.25.2018 with 6009241741 Profit.
TP5 @ 130.04 touched at 04.25.2018 with 9063241741 Profit.
1099241741 + 2629241741 + 4449241741 + 6009241741 + 9063241741= 8177725223
Open Profit:
Profit for one trade is 88.97208259(current price) -39.40758259(open price) = 4956450000
1 trade(s) still open, therefore total profit for open trade(s) is 4956450000 x 1 = 4956450000
All SLs moved to Break-even point.
Take Profits:
TP6= Free
Technical analysis:
Decred/Dollar is in an Up Trend and Continuation of up trend is expected.
The price is above the 21-Day WEMA which acts as a dynamic support.
The RSI is at 75.

Decred DCR and Crypto Hodl for 2018 & beyond Roadmap [BTFD]Decred is a multi-platform digital currency with support for Windows, macOS, and Linux. Easy-to-use wallet apps enable sending, receiving, and mining Decred with just a few clicks.
Been buying up DCR on the lows in the past few years but not as much recently, been holding since last year on this one as it was one of my featured coins to hold back in winter 2017
DCR shows really strong support around $30-40 floor, we could see this retested again and be a great time to buy in again, Blue line is the baseline and should not fall much under this, good BTFD moments if it does - excellent profits if it comes back up to test the ath
dont forget if your holding lots of DCR, consider buying tickets and staking your hold for more returns
Decred has a massive dev team and supporters with focus on governance and progression
$SALT
$ARK
$GNT
$DCR
$XEM <------- next TA
$EQT
$OMG
$STRAT
$STORJ
$BTS
$LBC
$NEO

Decred Rejected The SupportDecred seem to find the support at 88.6% Fibonacci retracement level that is $37. Price rejected the support together with the 8/1 Gann Fan trendline. The following wave up resulted in the break above the downtrend trendline, suggesting either a correctional move up or a trend reversal.
The resistance is seen at $80 area, this could be the first upside target for the potential upcoming wave up. Second resistance is near $90, that could be the decition point for DCR/USD. Break above $90 should establish a long term uptrend while rejection would result in a correction down.
On a downside, daily break and close below $37 support should invalidate bullish outlook and extend the consolidation.


DCRUSD , weekly update:Total profit 13423147646 in 15 days.!DECRED/DOLLAR
New trading suggestion:
*The price is in a range bound, but we forecast the uptrend would begin.
*There is still possibility of temporary retracement to suggested support zone (36.90 to 22.30), if so, traders can set orders based on Price Action and expect to reach short-term targets.
Beginning of entry zone (36.90)
Ending of entry zone (22.30)
Entry signal:
Signal to enter the market occurs when the price comes to "Buy zone" then forms one of the reversal patterns, whether "Hammer" or "Trough" , in other words,
NO entry signal when the price comes to the zone BUT after any of reversal patterns is formed in the zone.
To learn more about "Entry signal" and special version of our "Price Action" strategy FOLLOW our lessons:
Trade Setup:
We opened 6 BUY trade(s) @ 39.40758259(day close price) based on the reversal candle (Hammer) at 04.01.2018.
Total Profit: 13423147646
Closed trade(s): 3728483482 Profit
Open trade(s): 9694664164 Profit
Closed Profit:
TP1 @ 50.40 touched at 04.07.2018 with 1099241741 Profit.
TP2 @ 65.70 touched at 04.15.2018 with 2629241741 Profit.
1099241741 + 2629241741 = 3728483482
Open Profit:
Profit for one trade is 63.64424300(current price) -39.40758259(open price) = 2423666041
4 trade(s) still open, therefore total profit for open trade(s) is 2423666041 x 4 = 9694664164
All SLs moved to Break-even point.
Take Profits:
TP3= @ 83.90
TP4= @ 99.50
TP5= @ 130.04
TP6= Free
Technical analysis:
Decred / Dollar is in a range bound and Beginning of up trend is expected.
The price is above the 21-Day WEMA which acts as a dynamic support.
The RSI is at 65.
