DENT-BULLISHDent has shown a strong trend to the upside,given enough volume we could see DENT push through that resistance and rallly higher
DENTUSDT trade ideas

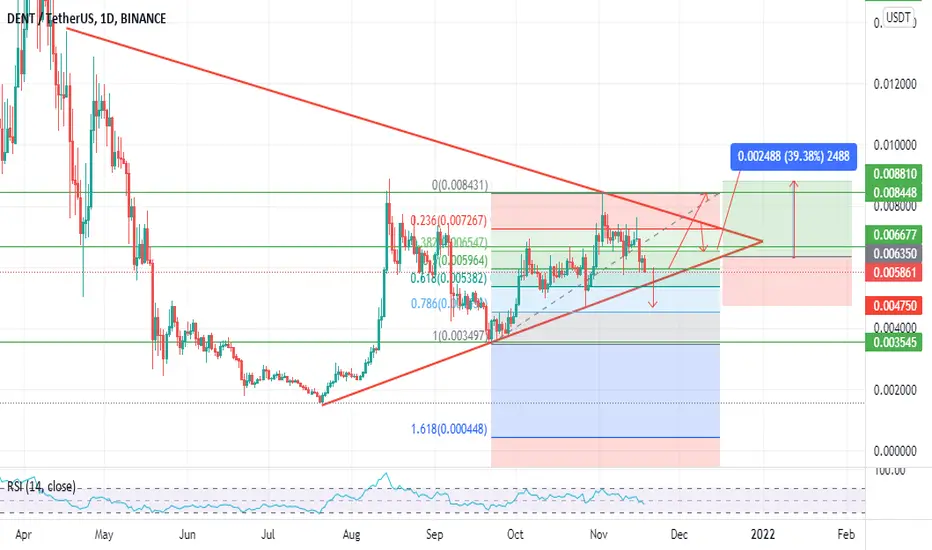
Dent Ascending triangleJust an analyses of Dent on the uptrend.
Dent finds good support on the way up, lets hope to see a continuation of this uptrend.

DENT/USDTHello Everyone,
Dent is seeking support on trend line if candle close above its support take long & enjoy big big profit.
Like & Follow for Free signal & Information.
Thank you.

DENT - Multiple Bounces!Everytime Dent comes back to the ascending trendline, we see some sort of bullish reaction.
We are once again back at the trendline and seeing some sort of bullish price action indicating that we may once again see a push up.
Trade Idea:
- Risk entry now
- Safe entry after break of descending red trendline
- Stops below the ascending trendline (if we break that, our bullish outlook will be invalidated)
- Target recent highs as first TP
Goodluck!

DENTUSDTWe are Ready to buy DENTUSDT. strong support. short term trade . entery ,exit and profit levels !


Buy Dent for over 0.022 usdEven if the price breaks the support (red line), don't worry. The price will return from the support I mentioned before it drops too much. Whether the support is broken or not, the price will rise hardly. This place can be considered an ideal long-term buying point for the price. The target is above 0.022 usd. Although I can't give a clear price target at the moment, 0.05 usd or more can be seen in the long term. Buy it and sell it at a price that makes you happy, over 0.022 usd.

DENTUSDT // Up Trend From my ideas // DENTUSDT seem to be a upward trend if it not break the support trend line.

Dent/USDT Head &Shoulders is coming
Dent/USDT Head &Shoulders is coming
If you have any suggestions, please leave them in the comments

DENT/USDT Dent going to form Head &Shoulders pattern
your short target will be zone 0.006790
support my work by clicking the LIKE button(If you liked) and follow me .Thank you!

DENTDENTUSDT
I think that if the dynamic support is broken, the price range of 25 can be a strong support.

DENT/USDTDENT/USDT
Higher Low and then TakeOff!
Entry Price: $0.0058 to $0.0060
Profit level: $0.0065 to $0.0075 (Short term)
Profit level: $0.0080 plus (long term).
Stop loss: $0.0048
DENT Price ProjectionAnother good buy opportunity for DENT wireless. From the bullish pattern inverted HNS, it just pulled back for confirmation.
This project is good for long term as well because fundamentally it disrupt the telecommunication industry.
#DENTWireless #DENTUSDT

Dent next is 1 centwe could witness another sell of and then load up at 0.0051 region .
chart looks good ,waiting for dent to show its strength.

DENT don't panic.As you can see we're still in an uptrend.
Ascending triangle structure is still in play.
The 50SMA worked as great resistance.
Finally we can see that 0.006 has worked as support and resistance multiple times lately, so we can see that's a point were people are interested in buying.
This market correction could be the last one before we head towards the proper alt-season.

DentLong 0.0126
Long 0.0126
Long 0.0126
Long 0.0126
Long 0.0126
Long 0.0126
Long 0.0126
Long 0.0126
Long 0.0126
Long 0.0126
Long 0.0126
Long 0.0126


DENT has a promising short-term futureHello,
Given the clear ascending triangle forming on the 15M chart, it can be said with high confidence that DENT will go ahead and retest the price point of 0.0074.
Given that the number of coin holders increases daily and now exceeds 75K - my personal assumption is that coin has a really bright future ahead. However, long-term projection are a bit early at the moment.
Let's see how the ascending triangle theory will play out.
Cheers.

DENT has fueled up the tankHello,
As we have previously predicted, DENT has successfully retested the resistance mark of 0.0074. as a part of its 5M bullish divergence cycle.
We have then monitored 15M cycle kick into action that has triggered a massive drop. However, the market has failed to reach the support trendline formed on Oct-27 and re-tested on Nov-11.
In addition to that, the inside bullish divergence is clearly visible. This concludes that the 15M cycle has now restarted.
Therefore, it could be concluded that the market is now entering its 15M bullish momentum.
Given that we are now in the bull phase on 1H chart, this might very well lead to the retesting 0.0084 price point.
Not financial advice. Do your research. Trade wisely!

DENTDENT (USDT)
buy if breaking down trend line
sell 25% of your profit at target 1
and sell 50% of your profit at target 2
and sell the last 25% at target number 3 .
Good luck ......

DENT/USDTHello friends, I am happy to comment on this analysis below this post. ⭕📌Please like this post to support us and follow us. Thank

DENTUSDT RR 1:5DENTUSDT
Entry price near 0.0071
Stop loss 0.006600
Take Profit 0.0076 0.0085 0.0094
Risk Reward 1:5
