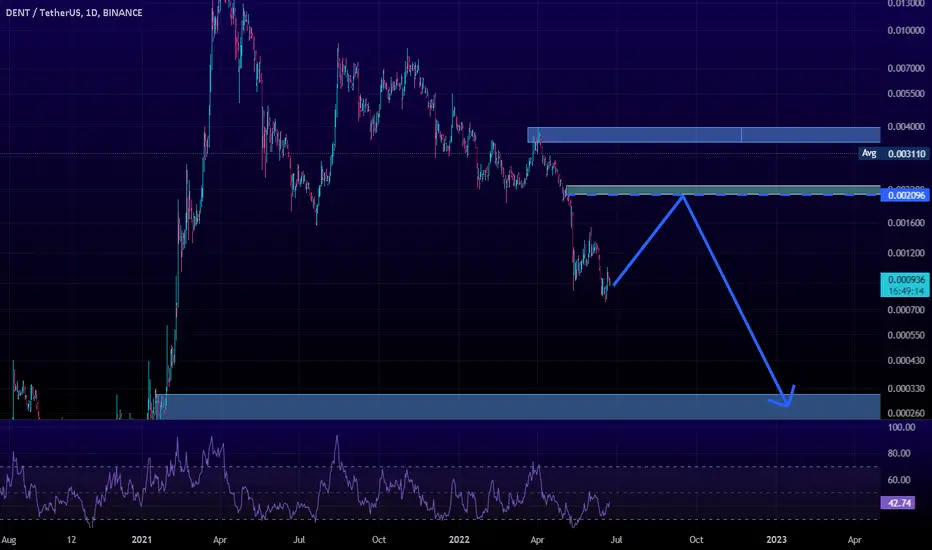
DENT Must HoldAs real as it gets. Chart showing a dip down to 0.0005 but we are down from 0.02 all time high.
DENTUSDT trade ideas


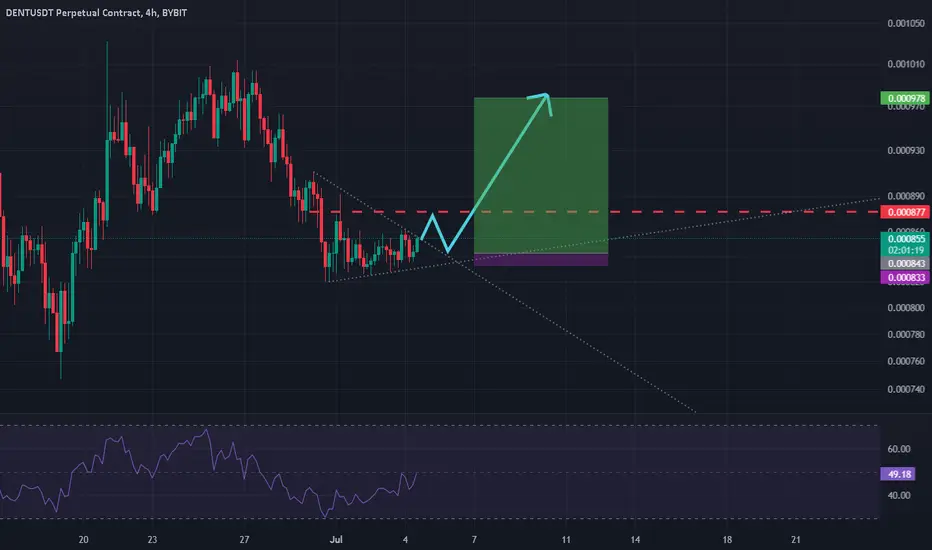
DENTLiterally shouldn't drop below 0.001 again. This is a huge descending triangle, it would make more sense if the price explodes when fully pinched. A break down will destroy the chart. Check out GRT idea
Targets are made using previous trend

Dent AnalysisHead and shoulders on DENT. Very big resistance here with cheap azz prices WHERE THE WHALES AT

DENT About to Explode?Descending Triangle on DENT. There's no where the price can go if this breaks down lets get this money back


SHORT TRADING 7X CROSS MARGIN FUTURE, USING THE 3HR TIME FRAME.ENTRY POINT: 0.000941. STOP LOSS: 0.001063.
NOTE: The entry trigger is a 3hrs reverser candle stick which can be a full red candle stick or a shooting star candle stick and not a hammer candle sick, once this is formed, you can enter your trade.
1). Set you stoploss and take profit. for this trade i didn't set a take profit because i believe the price is going to fall really deep, but as your trade progress make sure to push your stoploss closer to minimize losses.
2). Do not enter the trade if you do not see an entry trigger.

Huge potential Altcoin (Dent)The ATH was in 2018 and not in 2021. This is why I label this wave up as wave (A) and not (1); the long term trend might be bearish. But the wave (C) higher might have enormous potential, it should at least go back to the extreme of wave A or its neighbourhood. Wave 5 of C of (B) is on the way. Wait for confirming price action before acting.


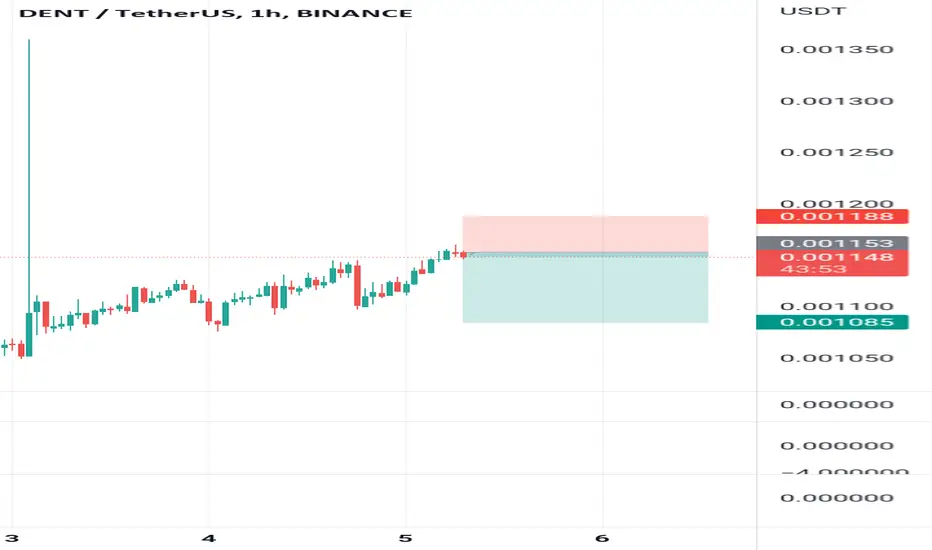
DENT is Ready For LONG PositionDENT /USDT is Going to get a good setup for LONG POSITION
you can get this position with LEV7 X
Good Luck & dont forget to set SL & TP

A Long position in DENTUSDT ChartAccording to the chart, we take a Long position with a risk to reward of 8.67.
a good investing
what do you think ??

Dent Targeti think DENT has a very good volume in the last days , as we see in the chart i personally expect to reach 0.00220 this month if we pass 0.00161 other way may....
not financial advise

Dent TargerDent has already started to rise i think it's an excellent area to buy.
not financial advice.

DENT could absolutely skyrock!I'm convinced that Dent could absolutely skyrock ones the daily resistance is broken.
I set my target by the end of the year on 0.04 cents minimum!
After seeing the fundamentals of this project and the performance it already has proven to do in the previously bull run, sky is the limit. Great project + great opportunity to make some decent bucks on this coin 👍
Dent is going to be one of my longer holding upcomming years!

DENTDent Technical analysis basically on elliott waves Princiles and Priceaction Strategy
Dent can be Grow fast
Wait and watch


dentusdt I set the position with just my method , and order book 50% probability will do it and 50% will dont
So I consider capital management
DENTUSDTN wave formation on the 4hr time frame which was formed above the Ichimoku Kumo. Price bounced off the Kijun-sen which is considered medium strength support. That bounce also correlates with the fib golden zone.

dentusdtHello dear trader, as you can see in the chart, everything is clear, I mean supply and demand areas, so you can make a better decision.
But I must say it has done well in recent crashes
DENTUSDTSo far it has progressed according to the analysis of the past.
The bearish wave of the DENT continues until the specified price targets

Price projection DENTUSDTdentusdt making falling wedge pattern and we can see macd histogram is very weak so this is indicate for reversal.
you can buy now!
im sorry, i tell the truth.
