Will It Breakout?This stock is very slow with low volumes most of the time, overall insurance sector is under pressure for now. If this pattern gets activated it can be a very profitable trade. This is a bullish chart identified on a weekly time frame so the effect can bigger. Its in a range since so many weeks if i
−0.116 AED
−40.05 M AED
55.74 M AED
134.56 M
About AMAN (DUBAI ISL IN
Sector
Industry
CEO
Rached Diab
Website
Headquarters
Dubai
Founded
2002
ISIN
AED000401011
FIGI
BBG000Q4PTW6
Dubai Islamic Insurance & Reinsurance Co. engages in the provision of insurance services. It operates through Investment and Other Segments. .The Investment segment represents cash management, and securities and properties investment. Others represent income and expense activities conducted by the subsidiaries. The company was founded in 2002 and is headquartered in Dubai, United Arab Emirates.
Related stocks
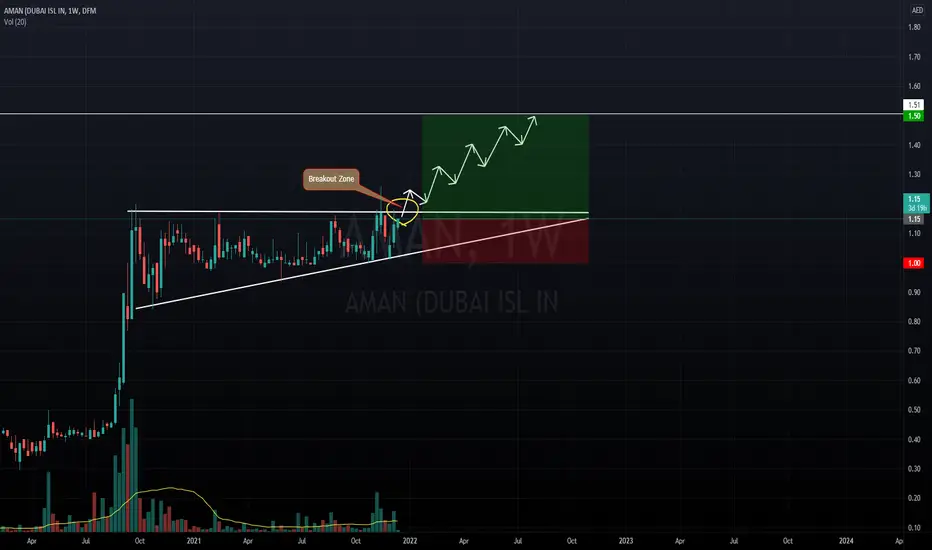
South or North?If we see the bigger picture on a weekly chart, we can see a breakout of a pole and a flag pattern. Yes we can see the breakout already and if the next candle or the last weeks candle can be taken as a retest candle which is a "success" for now then we can expect this stock to move slowly the the ne

Massive PatternIf we look at the bigger picture on a weekly chart we can see a massive pole and flag pattern breakout, i see a huge potential to upside coming up...surely i am holding this one !!! very bullish!1
Hit like & follow guys ;)

Wait for a confirmationIts at a strong resistance we can see its opening with a gap down on daily basis its a indication of weakness. This resistance area is been tested again and again but with intervals, for now wait for a breakout above the resistance around 1.18 and then enter the trade. Yes the trend is still to the

Good MoveAman made a good move last week, this stock is bit slow if it crosses the resistance of 1.18 with good volumes the next target can be 1.25 are as thats a strong resistance for now. Also due at the same time we can see some weakness with thin volumes as it open with a gap down in last session so exp

AMAN daily analysis Hi friends
the daily chart of this market shows with a high probability that the first goal will be the level of 0.79 and if there will be a breakout at this level the second goal will be the level 0.49

Watch itIts in a uptrend as of now in a range and it can explode the to upside once it crosses 1.15 which is a strong resistance as of now.Lets wait for a close above it and enter the trade. Bullish
Hit like & follow ;)

Stick to the planStill its the same as per the trade plan if you have entered the trade hold on more upside expected. Keep a tight stop loss and stick to your trade plan.
Hit like & follow ;)

Bullish PatternIt was one of the top traded stocks recently and its still in a uptrend. We can clearly see a bullish head & shoulder pattern and it have already given a breakout. Its coming back for a retest its a good chance to buy if you have missed it the next target is 1.16 looks very bullish.
Hit like & fol

It just got stuckAman was one of the best performing stock but it got resisted at 1.19 and since then its been retracing. Still we can say its in a uptrend soon the results will be announced which is expected to be positive as we are in covid times and insurance sector have benefited the most during this hard times.

See all ideas
Summarizing what the indicators are suggesting.
Oscillators
Neutral
SellBuy
Strong sellStrong buy
Strong sellSellNeutralBuyStrong buy
Oscillators
Neutral
SellBuy
Strong sellStrong buy
Strong sellSellNeutralBuyStrong buy
Summary
Neutral
SellBuy
Strong sellStrong buy
Strong sellSellNeutralBuyStrong buy
Summary
Neutral
SellBuy
Strong sellStrong buy
Strong sellSellNeutralBuyStrong buy
Summary
Neutral
SellBuy
Strong sellStrong buy
Strong sellSellNeutralBuyStrong buy
Moving Averages
Neutral
SellBuy
Strong sellStrong buy
Strong sellSellNeutralBuyStrong buy
Moving Averages
Neutral
SellBuy
Strong sellStrong buy
Strong sellSellNeutralBuyStrong buy
Displays a symbol's price movements over previous years to identify recurring trends.
Frequently Asked Questions
The current price of AMAN is 0.300 AED — it hasn't changed in the past 24 hours. Watch AMAN (DUBAI ISL IN stock price performance more closely on the chart.
Depending on the exchange, the stock ticker may vary. For instance, on DFM exchange AMAN (DUBAI ISL IN stocks are traded under the ticker AMAN.
AMAN stock hasn't changed in a week, the last month showed zero change in price, over the last year AMAN (DUBAI ISL IN has showed a −21.05% decrease.
AMAN reached its all-time high on Jan 23, 2014 with the price of 1.560 AED, and its all-time low was 0.295 AED and was reached on Mar 17, 2020. View more price dynamics on AMAN chart.
See other stocks reaching their highest and lowest prices.
See other stocks reaching their highest and lowest prices.
AMAN stock is 0.00% volatile and has beta coefficient of −0.10. Track AMAN (DUBAI ISL IN stock price on the chart and check out the list of the most volatile stocks — is AMAN (DUBAI ISL IN there?
Yes, you can track AMAN (DUBAI ISL IN financials in yearly and quarterly reports right on TradingView.
AMAN net income for the last quarter is −23.04 M AED, while the quarter before that showed −3.63 M AED of net income which accounts for −535.06% change. Track more AMAN (DUBAI ISL IN financial stats to get the full picture.
No, AMAN doesn't pay any dividends to its shareholders. But don't worry, we've prepared a list of high-dividend stocks for you.
Like other stocks, AMAN shares are traded on stock exchanges, e.g. Nasdaq, Nyse, Euronext, and the easiest way to buy them is through an online stock broker. To do this, you need to open an account and follow a broker's procedures, then start trading. You can trade AMAN (DUBAI ISL IN stock right from TradingView charts — choose your broker and connect to your account.
Investing in stocks requires a comprehensive research: you should carefully study all the available data, e.g. company's financials, related news, and its technical analysis. So AMAN (DUBAI ISL IN technincal analysis shows the sell today, and its 1 week rating is sell. Since market conditions are prone to changes, it's worth looking a bit further into the future — according to the 1 month rating AMAN (DUBAI ISL IN stock shows the sell signal. See more of AMAN (DUBAI ISL IN technicals for a more comprehensive analysis.
If you're still not sure, try looking for inspiration in our curated watchlists.
If you're still not sure, try looking for inspiration in our curated watchlists.