Breakout & watchoutFinally it made a good move to the upside, it can be a very good and profitable swing trade. Stop loss is tight and at a safe place target is huge!! after the just wait for a small retest to enter the trade. I am pretty sure after this big move some profit booking will happen during the week. As its still not confirmed if this is a real breakout or a fake breakout!!! After a succesful retest enter the trade.
Entry : 0.274 to .276 area
Stop Loss : .266
Target : .297 & .320
Hit like & follow guys ;)
UPP trade ideas


Again Wait & WatchMost of the stocks in Dubai Stock Market are just at the same place without any moves, market is waiting for some good news. Will todays news by IMF push the market to the upside? Lets wait for the breakout.
Hit like & follow guys;)

Union Properties Good Time To BuyI see a nice bullish candlestick pattern right at the support level. Its been falling since so long but after the news it have shown some price action and on weekly chart we can see a bullish engulfing pattern. At this level the stop loss will be very tight and target is good too. Bullish for now
Entry Price : 0.260 - 0.267
Stop Loss : 0.257
Target : 0.298
Risk Reward : 3
Hit like & follow guys ;)

UPP (DFM) - It is time to break and BullishHumbled, we would like to thanks for your support who has already liked, commented and followed us. Your support, strengthens us, to help in analyzing the market.
If you have any questions, do not be hesitant to send us message (inbox). Again, We have also provide signal recommendation with detail instruction
UPP ( DFM ) - It is time to break and Bullish


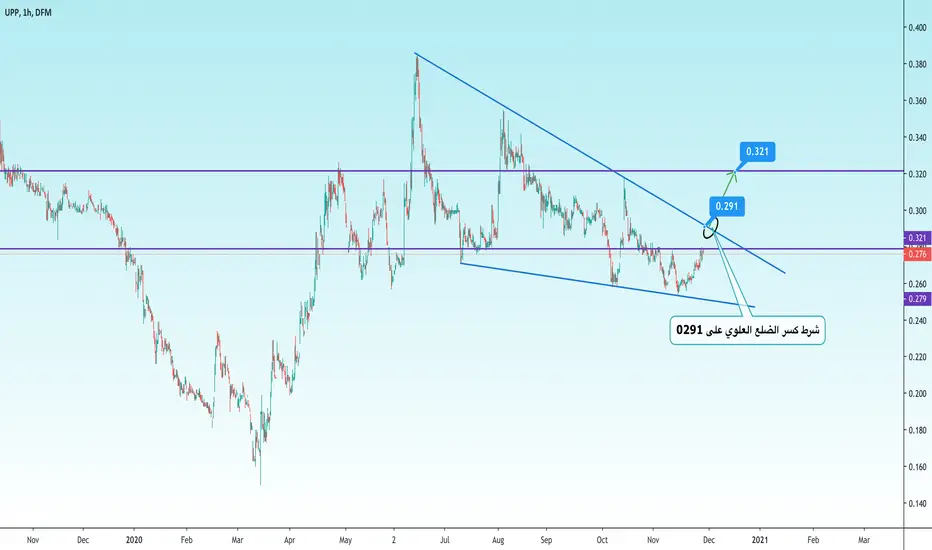
In a PatternUPP is trading in a pattern as of now there are good chances it can break to the upside. If it breaks to the upside we can have a very good target at around 0.330 to 0.340 area we have to wait and watch the breakout. If you have already entered the trade hold on to it if you are still about to buy thn hold till you see a breakout of this pattern.
Hit like & follow guys ;)

Hold ItUpp after consolidating for so many days it finally made a breakout and its now in a retest mode and its holding around 0.298 to 0.30 levels which is support for now. Its still bullish and big move is expected to cross the near term resistance of 0.305 area. Keep a stop loss around 0.292 and target at 0.340 to complete the swing.
Hit like & Follow guys

Under PressureIt have not been performing lately as of now its at a solid technical resistance and also in a near term downtrend. It have to cross this resistance line that is 0.280 and the next resistance is 0.295. If it does not hold and break up side next support is 0.722 levels.
Hit like & follow guys ;)

Will it Break?It have tested 0.313 so many times its a resistance level. When a particular level is tested again and again it becomes weaker and it can break easily. This level is been tested so many times and i think this time it will break and go past 0.313 yes its bullish for now but at a support level it should hold and not close below it.
Hit like & follow guys ;)

Trend Line Is BrokenIt have finally broken the trend line but with last closing the candle is very bearish indicating there are chances of retest. I would like to see a closing above .305 today which will be a good weekly closing. Check out the resistance level to take the trade.
Hit like & follow ;)

Nice Bounce!!!A green candle right at support level is indication of good buying and confirmation. Its looking bullish now after it have taken a support from 0.260 levels. As of major resistance at around 0.280 first target should be around 0.313 and second major target should be around 0.343 levels over all now getting in action and starting to be bullish.
Hit like & follow guys

Good for buyIts at very nice level as we can see it broke the neck line that was resistance which will now act as a support level. Clearly in thursdays session it came back for a retest and have taken a bounce. Tomorrow most likely it will push to the upside next hurdle is at 0.290 bullish mode!!
Hit like & follow guys ;)

UPP getting ready to start next bullish move expecting to see strength on UPP (DFM )
this move could be impulsive and can take this ticker from 0.24 to 0.45 then to 0.53

No PowerIt took a bounce from support level but no bull power its in a down trend as of now so we stay away from it. Never buy a stock if its in a down trend. We wait for a reversal and then we enter the trade when we see a bullish sign. TIll that time stalk this one.
Hit like & follow guys ;)

StrugglingIts been trying hard but it comes back to the support level which is now very weak as its been tested again and again. Today again it have taken a bounce from the same support level no confirmation yet we can call it bullish when it will clear the solid technical resistance level of 0.280 levels. Till thn keep stalking!!
Hit like & follow ;)


BullishIt have tested the same level 0.264 four times now. We are seeing a bullish candlesticks right at the support level. If you have entered the trade first target is 0.280 for now. Still the trend is to the downside. In order to start a uptrend it have to cross 0.280 with a solid green candle in this case we will see a new high and it will cross the previous swing high. A small retracement again which should be a higher low and contiune to the upside this will be a proper bullish price action. For now its good for intraday trading!!
Hit like & follow guys !!

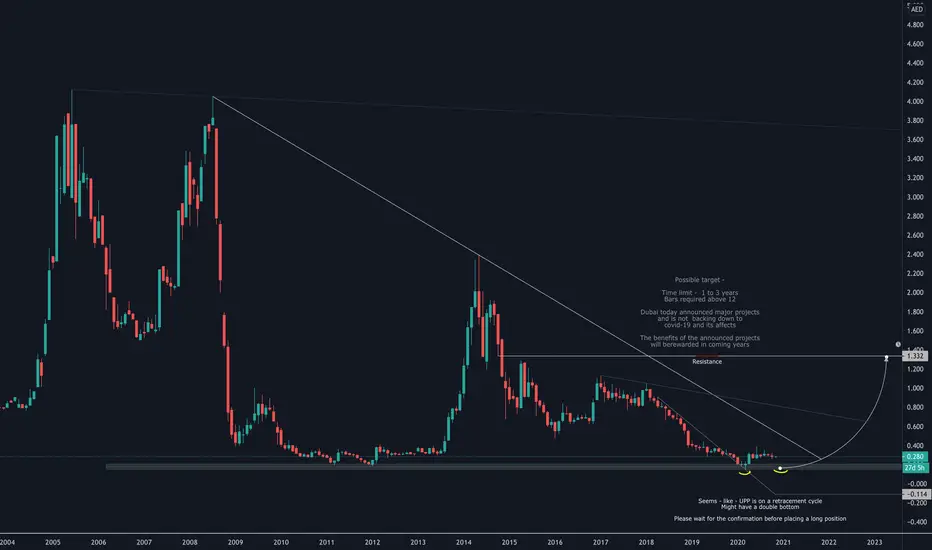
UPP - heading down to .210 or .170 area***Please follow, support, and like this idea if it helped you in anyway***
***This is not a financial advise***
UPP - seems like UPP is heading towards .210 to .170 area, the overall charts looks bearish and if the major support is able to hold the current downtrend than we shall take the long positions till the suggested target.
It seems that the chart might have a double bottom and a major support might change the current falling trend to a bullish trend
Good for buyThis is one of my favorite stock i have been stalking this one for quiet a time now. Right at the support we can see 2 bullish hammer candles. If over all market is positive i think this one is ready to fly. My trade plan to buy this - if it opens with a gap i will buy when it comes down, if it opens flat i will buy immediately, it it opens down i will not trade i will wait for the price action for a confirmation. Looks very bullish to me!!
Hit like & follow guys ;)

Weak SupportIf a particular support level is tested again and again clearly it becomes weaker and eventually it breaksdown. UPP have to move away from this level quickly as this level of 0.278 to 0.280 is been tested so many times and it can break to the down side. It looks bearish to be as of now.
Hit like & follow guys to show your support.

