DFUSDT CHART ANALYSİS - EDUCATIONAL POSTThe NFT Concept
You may already know that each unit of value in a blockchain is called a token. In an open blockchain, all tokens are equal and interchangeable. For example, one bitcoin can be easily replaced with another, and nothing will change.
Non-fungible tokens are a game-changer, which work differently. An NFT is a digital asset that cannot be replaced with another token without changing the value and basis of the object.
Like cryptocurrency, NFTs are created on a blockchain, which acts as a database to record all transactions. The blockchain guarantees the uniqueness, safety, and anonymity of non-fungible tokens. Thanks to this system, any user can verify the originality and transparency of the history of a particular NFT through the blockchain.
When you buy an NFT token, you are obtaining a certificate for a digital or real object. However, the work itself doesn’t move anywhere. You only use its digitized file or a certificate of ownership. Once created or purchased, the token sits in perpetual storage. This certificate is just lines of code that confirm it is the token owner who has the original copy of the object.
An NFT token can be compared to a painting, which may belong to a gallery, museum, or individual, but the audience can see it in a catalog or exhibition.
NFT tokens are sold in online marketplaces that operate like Amazon. The creators put them on marketplaces and wait for bids from buyers.
An NFT token can be created by you or by anyone for that matter. To do this, you need to take a digital object (picture, music, photo, etc.), register in a particular marketplace on a platform such as Rarible or OpenSea, and upload the object with a description and price. You will have to pay a fee for creating a blockchain entry on many platforms. However, the costs pay off in most cases, as NFTs are #1 in the crypto world today.
DFUSDT trade ideas

DF is on strong supportNow DF is strong support. Im waiting to go up from here. I bought here and my tp is 0.02400

Analysis and Trading Plan for DFUSDT: Targeting a 45% ProfitTrading Plan
Type: Spot trading, using only available capital, avoiding leverage or borrowing to minimize risk.
Entry Point: $0.08259 – the current price, validated by technical support and steady buying pressure.
Profit Target: $0.11975 – a 45% increase, based on the nearest historical resistance level.
Holding Period: 1 week – a reasonable timeframe for the price to reach the target without unnecessary exposure to prolonged risk.
DFUSDT presents a viable short-term opportunity for a 45% gain, supported by current technical indicators and market momentum. Success hinges on precise timing and strict adherence to the risk management strategy. If executed well, this trade could deliver results within a week.
Best of luck with your trading!

DF/USDT NEW INCREASEDF/USDT NEW INCREASE
This coin looks for day trading interesting and can show some volume trends

DF/USDTKey Level Zone : 0.09680 - 0.09800
HMT v3.1 detected. The setup looks promising, supported by a previous upward/downward trend with increasing volume and momentum, presenting an excellent reward-to-risk opportunity.
HMT (High Momentum Trending):
HMT is based on trend, momentum, volume, and market structure across multiple timeframes. It highlights setups with strong potential for upward movement and higher rewards.
Whenever I spot a signal for my own trading, I’ll share it. Please note that conducting a comprehensive analysis on a single timeframe chart can be quite challenging and sometimes confusing. I appreciate your understanding of the effort involved.
Important Note :
Role of Key Levels:
- These zones are critical for analyzing price trends. If the key level zone holds, the price may continue trending in the expected direction. However, momentum may increase or decrease based on subsequent patterns.
- Breakouts: If the key level zone breaks, it signals a stop-out. For reversal traders, this presents an opportunity to consider switching direction, as the price often retests these zones, which may act as strong support-turned-resistance (or vice versa).
My Trading Rules
Risk Management
- Maximum risk per trade: 2.5%.
- Leverage: 5x.
Exit Strategy
Profit-Taking:
- Sell at least 70% on the 3rd wave up (LTF Wave 5).
- Typically, sell 50% during a high-volume spike.
- Adjust stop-loss to breakeven once the trade achieves a 1.5:1 reward-to-risk ratio.
- If the market shows signs of losing momentum or divergence, ill will exit at breakeven.
The market is highly dynamic and constantly changing. HMT signals and target profit (TP) levels are based on the current price and movement, but market conditions can shift instantly, so it is crucial to remain adaptable and follow the market's movement.
If you find this signal/analysis meaningful, kindly like and share it.
Thank you for your support~
Sharing this with love!
HMT v2.0:
- Major update to the Momentum indicator
- Reduced false signals from inaccurate momentum detection
- New screener with improved accuracy and fewer signals
HMT v3.0:
- Added liquidity factor to enhance trend continuation
- Improved potential for momentum-based plays
- Increased winning probability by reducing entries during peaks
HMT v3.1:
- Enhanced entry confirmation for improved reward-to-risk ratios

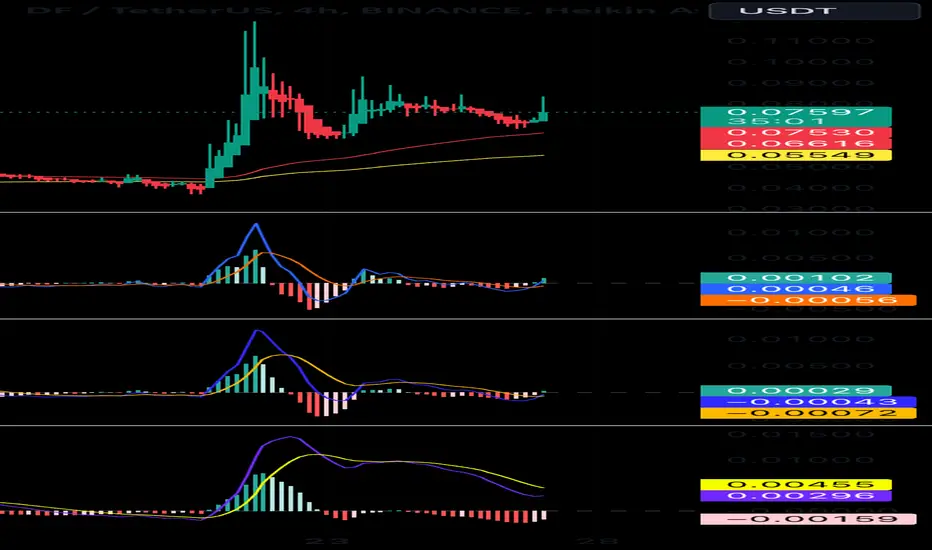
Prepare to BUY Spot DFUSDT on the H4 Cycle (Short-Term)
🌟 Capitalize on Quick Gains with DFUSDT! 🌟
🌍 Market Overview:
DFUSDT is showing strong potential for a short-term upward move on the H4 timeframe, making it an excellent candidate for quick profits.
📊 Trade Plan:
📌 Entry: Around $0.07 – Optimal range to secure your position.
🎯 Target: +40% – Aiming for solid gains within the short-term cycle.
⏳ Hold Time:
If the wave begins intraday: Exit once the target is achieved.
If not: Hold until the end of the week at most.
🔍 Strategy Insights:
My custom indicator RainBow MG3 has flagged DFUSDT as a promising opportunity for quick profits.
Market conditions and momentum on H4 suggest a strong likelihood of hitting the target.
🚀 Next Steps:
💬 Reach out for additional guidance or tailored strategy support.
💡 Note: This is not financial advice. Always DYOR before making any trading decisions.
🔥 DFUSDT is primed for quick action – Don’t miss this opportunity! 🔥
DF COIN PRICE ANALYSIS AND NEXT POSSIBLE MOVES!!TSX:DF Coin Updates!!
• in this week TSX:DF Coin Almost surge 200%+ & Now we are seeing massive correction in its price🚨
• Near Me in Next few Hours if its price drop b/w 0.06$-0.055$ then Pottenial bounce back expected✅
Warning : That's just my analysis if i take trade i will updates DYOR Before Taking any action🚨

Crypto Pick of the Day: DFUSDT (Spot)
🌟 Get Ready for the Next Big Move with DFUSDT! 🌟
🌍 Market Overview:
DFUSDT is showing strong bullish signals on the D1 timeframe, offering a great opportunity to accumulate before a potential breakout.
📊 Trade Plan:
📌 Entry: $0.04 - $0.055 – Ideal range for accumulation with controlled risk.
🎯 Target: $0.1 – Aiming for a potential 2x gain.
⏳ Hold Time:
Short-term Spot: Trade based on H4 for quick profits.
D1 and W Cycles: Hold for mid-term gains to ride the bigger trend.
🔍 Strategy Analysis:
Using my custom indicator RainBow MG3, I’ve identified a clear uptrend.
Market conditions support high-reward opportunities with manageable risks.
🚀 Next Steps:
💬 Reach out if you need more details or support with strategies!
💡 Note: This is not financial advice. Always DYOR before trading.
🔥 DFUSDT is ready – Are you? Let’s catch the wave! 🔥

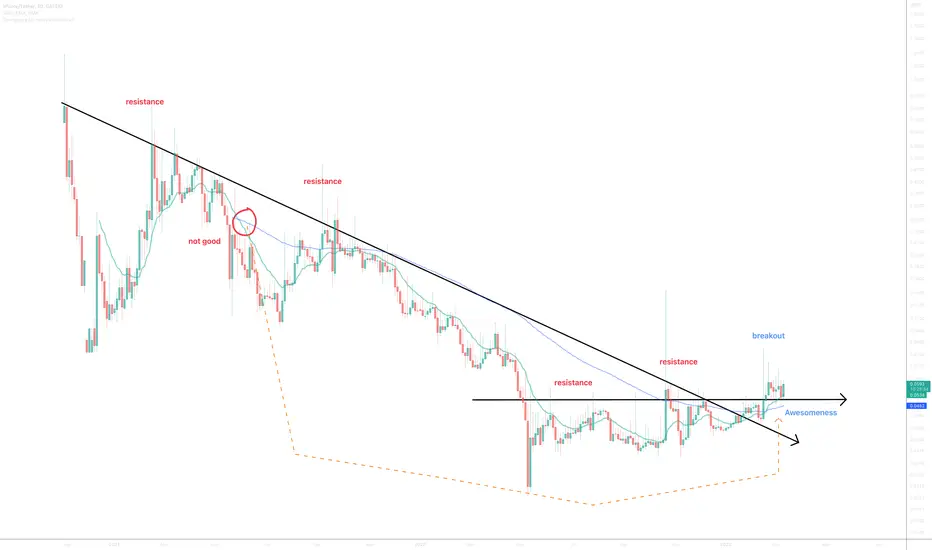
DFUSDT: %1000 VOLUME SPIKE, HUGE OPPORTUNITYDFUSDT has seen a 1000% increase in volume, signaling growing interest. However, there’s no need to rush, as buyers have not yet stepped in. The chart highlights the first buying zone, which serves as a key level for potential entries.
For precise trades, watch for upward breakout reactions on lower time frames within this zone. Prioritize careful risk management to navigate potential volatility effectively.
I keep my charts clean and simple because I believe clarity leads to better decisions.
My approach is built on years of experience and a solid track record. I don’t claim to know it all, but I’m confident in my ability to spot high-probability setups.
My Previous Analysis
🐶 DOGEUSDT.P: Next Move
🎨 RENDERUSDT.P: Opportunity of the Month
💎 ETHUSDT.P: Where to Retrace
🟢 BNBUSDT.P: Potential Surge
📊 BTC Dominance: Reaction Zone
🌊 WAVESUSDT.P: Demand Zone Potential
🟣 UNIUSDT.P: Long-Term Trade
🔵 XRPUSDT.P: Entry Zones
🔗 LINKUSDT.P: Follow The River
📈 BTCUSDT.P: Two Key Demand Zones
🟩 POLUSDT: Bullish Momentum
🌟 PENDLEUSDT.P: Where Opportunity Meets Precision
🔥 BTCUSDT.P: Liquidation of Highly Leveraged Longs
🌊 SOLUSDT.P: SOL's Dip - Your Opportunity
🐸 1000PEPEUSDT.P: Prime Bounce Zone Unlocked
🚀 ETHUSDT.P: Set to Explode - Don't Miss This Game Changer
🤖 IQUSDT: Smart Plan
⚡️ PONDUSDT: A Trade Not Taken Is Better Than a Losing One
💼 STMXUSDT: 2 Buying Areas
🐢 TURBOUSDT: Buy Zones and Buyer Presence
🌍 ICPUSDT.P: Massive Upside Potential | Check the Trade Update For Seeing Results

Trade Signal for DFUSDT: Buy RecommendationWe have identified a potential trading opportunity for the DFUSDT currency pair, and our strategy strongly suggests a Buy direction. Below are the details of the trade setup:
Enter Price: 0.03005
Take Profit: 0.03101
Stop Loss: 0.02947
The prediction has been made using our advanced EASY Quantum Ai strategy. This strategy utilizes quantum computing principles and artificial intelligence to process massive datasets and identify market trends with high accuracy.
Justification for the Buy Recommendation:
1. Market Momentum: Recent analysis shows increasing bullish momentum in DFUSDT's price action, indicating a possible upward move.
2. Technical Indicators: Key indicators such as Moving Averages and RSI (Relative Strength Index) are signaling a buy, with values crossing critical thresholds supported by historical data.
3. Volume Analysis: Elevated trading volumes have been observed at the suggested entry level, which often precedes upward price volatility.
Exercise prudent risk management and monitor the market closely. Remember that trading carries risk, and no strategy can guarantee success. Adjust positions accordingly based on market changes and individual risk tolerance. Happy trading!

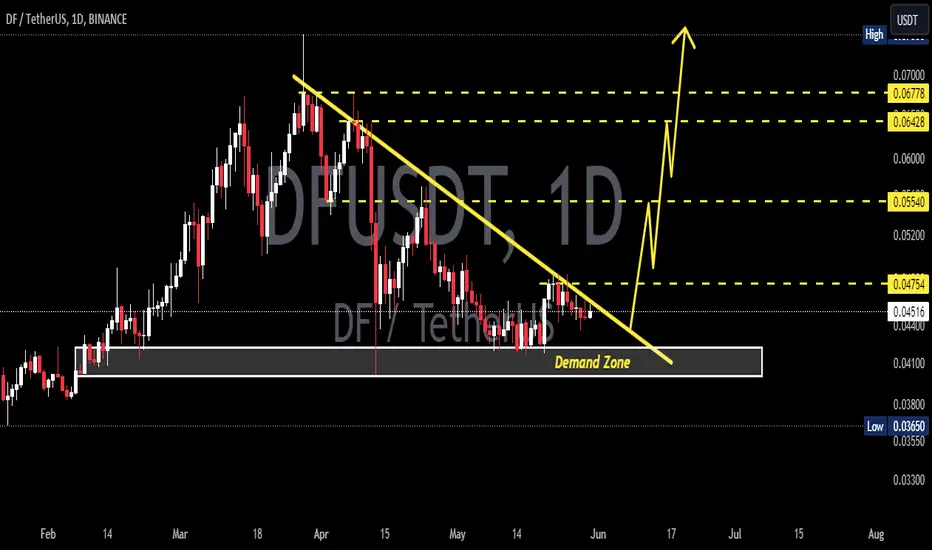
DFUSD 1DDF ~ 1D
#DF Make purchases gradually after breaking through this resistance line, or buy in the demand zone if possible. with a minimum target of 20%+
#DF/USDT - Long - Potential 33.45%Strategy: Long
Exchange: BINANCE
Account: Spot
Entry mode: Market order in range
Invest: Risk 1%
Exit:
• ⎿ Target 2 : 0.09252 33.41%
• ⎿ Target 1 : 0.07566 9.1%
Entry: 0.06935 ⌁ 0.06935
• ⎿ Current market price: 0.06939
Stop: 0.06116 (-11.81%)
Technical indicators:
Cup and handle into break through 6749 resistance.
• ⎿ 24h Volume: 9088402.10193
• ⎿ Satoshis: 0.06935
• ⎿ Analysis: TradingView

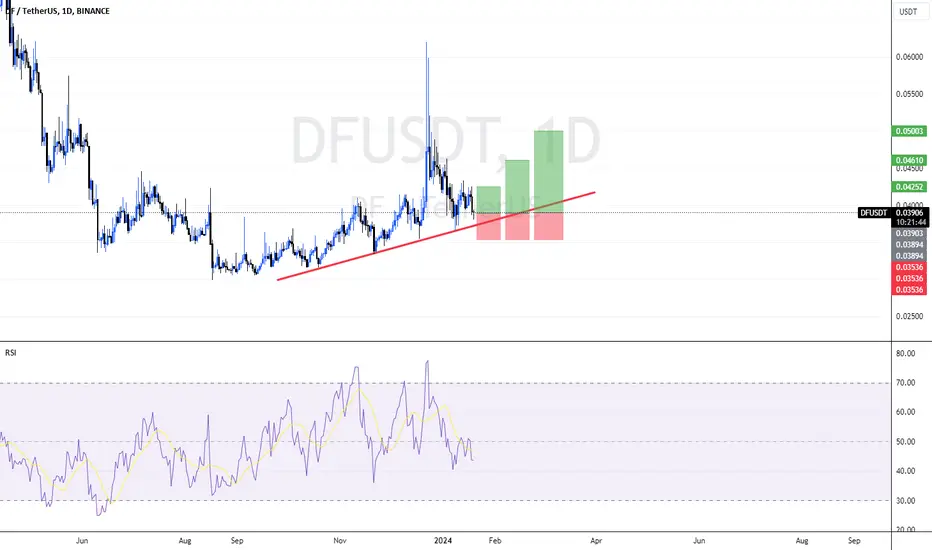
DFUSDTDF coin has much potential as its a Chinese coin and we have a Chinese new year in February. Previous Feb high was around 0.085 we can predict the same in this year too. Keep an eye on it!

DFUSDT - BULLISH OUTLOOKDFUSDT is currently demonstrating a bullish trend on the 1-day (1D) time frame, supported by a bullish trendline that has been successfully retested. Furthermore, there is a bullish divergence observed on the hourly (1H) time frame, indicating potential upward momentum.
Based on this analysis, a potential trading strategy could be implemented as follows:
Entry: Consider initiating a long position using a buy stop order at the price level of 0.3940.
Stop Loss (SL): Place a stop loss order at 0.3700 to manage risk.
Take Profit (TP): Set take-profit levels to achieve a 1:1 and 1:2 risk-reward ratio:
TP1: = 0.4180
TP2: = 0.4420
This trading strategy aims to capitalize on the anticipated bullish continuation. However, it's essential to closely monitor the market for any changes in price action and be prepared to adjust the strategy accordingly.

DFUSDT - BULLISH OUTLOOKDFUSDT is currently demonstrating a bullish trend on the daily time frame, marked by the formation of higher highs and higher lows. Additionally, bullish divergence on the 1-hour time frame adds strength to the potential continuation of this upward movement.
Consider entering a long position at the current market price (CMP) of 0.39. To effectively manage risk, set a stop loss (SL) at 0.3540.
The suggested take-profit (TP) levels are outlined as follows:
Take Profit 1 = 0.425
Take Profit 2 = 0.46
Take Profit 3 = 0.495
This trading strategy aims to capture profits at different levels while considering potential market movements. Always closely monitor the trade and adapt your approach based on changing market conditions.
DFORCE DF/USDTHistory has always been the most critical indicator in technical analysis for me. I aim to communicate how to observe the structure and always remain abreast. The asset is displaying a dynamic consolidation that encompasses the entire historical structure. We believe we are on the verge of a breakthrough and transitioning into a new wave structure.
As always, history serves as a crucial indicator in our analysis. We observe the asset's structure, witnessing a dynamic consolidation that encapsulates its entire historical movement. We are confident that we stand on the threshold of a new wave structure.

DFUSDT"As we enter the bullish season, the initial target to aim for is
target : 0.45 🎯.
This is based on a combination of technical analysis indicators and market trends.
However, it's important to approach trading with caution and adapt to changing market
conditions.
Keep an eye on key support and resistance levels, as well as any significant news or events that may impact the market.
Remember to use proper risk management techniques and consider setting profit targets along the way.
Happy trading!"

DFUSDT TODAY1-Apply your own risk management.
2-Daily and Weekly Targets
3-Hunt the profits at any level you see convenient for you.
4-Raise Often Your SL to protect your profits.
5-Use 8 % Spot
TSX:DF looks good

dFORCE Next TargetsDF is moving today. May gain some momentum.. and push up some greater buy volume
Targets on chart

DFUSDTDFUSDT is in bullish trend.
Printing HH and HL.
Continuation flag pattern also form.
We wait and watch for the breakout of last HH.

DFUSDTDFUSDT is in bearish trend.
Potentially printing LH and LL.
No sign of trend reversal from here.
We wait and watch for the breakout of last LL.


dForce DFOn the above 3-day chart price action has corrected over 90% since the early 2021. Now is a good opportunity to go long. Why?
1) A strong buy signal prints. (not shown).
2) Price action, RSI, and Money flow resistance breakouts.
3) Point (2) is also true for the BTC pair. Chart below.
4) The 3-day/40-day SMA crosses up the 3-day/100-day SMA. Very bullish for price action. These crosses were recorded on recent ideas such as Highstreet, ACH etc..
Is it possible price action could fall further? Sure.
Is it probable? No.
Ww
Type: trade
Risk: <=6% of portfolio
Timeframe: Don’t know.
Return: Don’t know.
3-day BTC pair