DGB – Digibyte – rebound possible soon – 182 % to be madeHi Guys!
Let’s have DGB on our radar.
The price is heading to the local min from April 2018.
From that point, we had a very nice bounce back in April and in June (although the start level was a bit higher).
Of course, it all depends on the sentiment on the crypto market. These two coins are truly convergent.
Let’s hope we will observe bounce off of the BTC then we can count on the nice profit on DGB.
So here are technical analysis details
• Entrance level at around 0.00000240
• RSI – the lowest ever since a year
• We are heading towards local support which was marked in April 2018.
• We can reach as high as 0.00000688
• Weis Volume Waves – the supply is slowly decreasing. All we need is the demand showing up.
• Stop-loss – 0.00000200
So Traders. Let’s wait for the levels of 240ish satoshi.
This might be a safe and profitable trade.
Keep watching our updates!
Thank you for being here. Remember patience and staying cool are the key factors. Don’t panic and don't sell your assets hastily.
MASSIVE Hugs!
WBM Team
DGBBTC trade ideas

DigiByte (DGB) EMA's showing Resistance DigiByte is that type of a coin that with all of the resistance holding DGB down, with the excellent support it always moves upwards...

DGB / BTCNOTICE ON THE 4 HR WE HAVE A NICE CHANNEL THAT FORMED
~ STAY TUNED FOR MORE UPDATES FROM THE "CRYPTO-WARRIOR"
** DO YOUR OWN RESEARCH **
* I DO NOT GIVE FINANCIAL ADVICE JUST MY OWN OPINION *


Digibyte | $DGB - $DGBBTC | 1D chart Support of Pennant holds.On the daily chart Digibyte looks also good, Support of the big Pennant has hold.
RSI looks good.

Digibyte | $DGB - $DGBBTC - Head & Shoulders on 4 hour TF.If we can break the neckline - Target = 355 sats
Stoploss @ 280 sats.

DGB reversalDGB is attempting to reverse its bearish trend
Two previous reversals have failed, but the last two times RSI dipped below 30 and rose back above there were sustained rallies for 15-30 days.
This is the first time I am placing buys on DGB in a long time, and this is one of those cycle coins like Doge, though less reliably.
RSI and Stock are signaling buys, price trying to close above the 7ma on a strong daily candle, but a drop below recent lows invalidates the idea. This is one where I will purchase 25% of desired position here, and pyramid orders to fill the other 75% down to the bottom of the current daily candle.
Watching todays close for a dirty "3 line strike" pattern. I want to see a close above 4 days ago and higher volume than the last 3 days.
Two swing trade ideas with a 10% SL below recent lows:


DGB - Slow Bleed OutDGB does not look like a good setup. Most of the buying occured at that lower PoC/HVN. Look for a potential entry at the .786 Fib, or for volume to confirm a bullish reversal Hammer candle or reversal pattern.

[DGBBTC] DigiByte Completes Retrace [95% PP]DigiByte is the great money maker for us, and when it goes it goes.
This altcoin is a classic and it is great for long term hold, it maintains its price strongly and it is starting to show signals of a reversal... Let's trade for profits, but a few signals first:
- Long bullish divergence vs MACD and RSI.
- Breaking above EMA10.
- Support tested twice.
- Increasing volume, highest since late September.
Trade instructions for DGBTC by Alan Masters
Buy in: 360 - 340
Targets:
(1) 390
(2) 430
(3) 490
(4) 540
(5) 590
(6) 683
Stop loss: Close daily candle below 322.
Enjoy this trade.
Namaste.


DigiByte is Having a Moment of Truth We haven’t really talked about Digibyte a lot, but this is an OG token (created before 2017). Thus, it deserves its just due and respect in being covered by us.
As one can see in the chart above, it appears that $DGB could be poised for a price run, however, there is no guarantee.
Similar to the other coins that we have covered today (November 10th, 2018), the price of $DGB is riding on a support at the current moment. So, if it falls through, then the losses could be substantial.
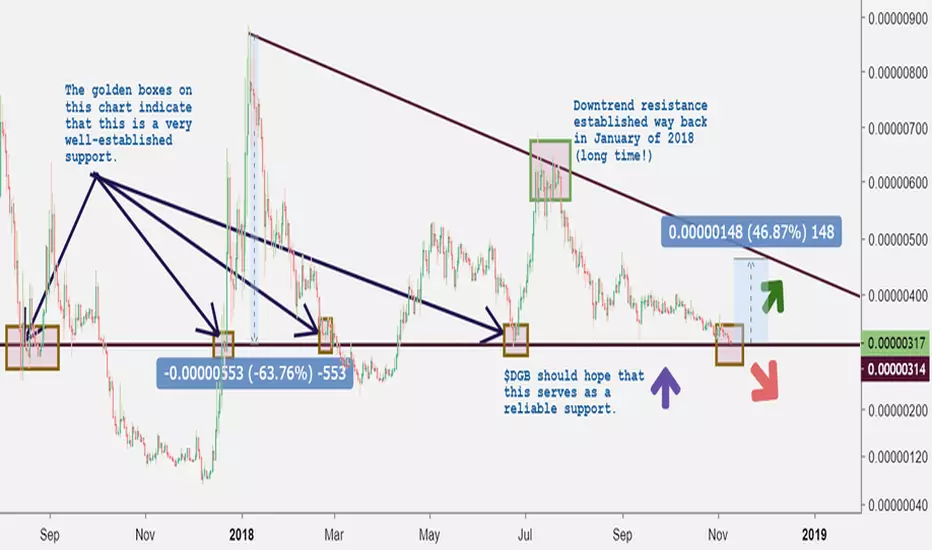
If we look back at the chart over time though, it does appear as though the resistance point that $DGB is currently hanging against is fairly substantial.
Downtrend Line
The downtrend line for $DGB goes all the way back to January 2018, which makes it really well-established.
However, the support line goes back even further, so we have recent to remain optimistic that it will hold in this scenario as well. Although, we won’t gamble on it because a sudden fall below the support line (and it has happened this year), would probably occur with price action that is moving so fast that a S/L may not be triggered fully (depends on the exchange + liquidity) before the price falls below the S/L point.
Therefore, we’re going to look at some cautious trading strategies on this one.
Potential Inverse BARR (Bump and Run Pattern)
As you can see in the chart above, the price action appears to be showing us a reverse BARR pattern.
Now, there’s a solid chance that this price action does not fulfill itself 100% for the DGB / BTC pairing, but it coming anywhere close would definitely be a major gift for Digibyte bulls.
In theory, this represents the potential gains that one could receive form the Inverse BARR
Bulls shouldn’t get too happy yet, and here’s why..
Taking a Look at the Fibonacci Levels
Since there is a wealth of price data for $DGB (remember this is an OG coin), we decided to draw the top of the Fib from the most recent localized high, which occurred in early January 2018.
The low for this indicator was drawn to 250 satoshis.
Here’s a graphic to show you exactly what we did:
As you can see in the chart above, it looks as though the price may have actually broken below the 78.6% retracement zone for the Fib (which would not be good for those that are anticipating bullish price action in the near future).
Let’s scroll in and take a better look at what’s going on:
Zerononcense Reversion Ribbon V2
The dark red candles are not a good sign on the reversion ribbon V2.
This indicates that the price could eventually make that nudge below the established support point that we pointed to at the beginning of this price analysis.
If that does happen, then once again, bulls could be in some serious trouble.
Relative Strength Index(14)
Again, what’s written on the chart above is pretty self-explanatory for the most part.
Conclusion
There’s not really much for us to do with $DGB #Digibyte for the time being except for wait (like one must do with a lot of other cryptocurrencies in the market currently).
If there’s a bounce, then it would definitely be worth placing a solid investment in the project.
If not, however, then that -20%+ loss would become more of a reality.

Update DGB.Do not consider any chart as an investment advice.
Do not consider time as correct. Waves can take time to build.
. Always create stop loss.
. DGB seems to be wanting to test lower levels. Buy a little before the support.

DGB sit inside, big move coming soon!
Hi everyone, this coin DigiByte is undervalue now, big potencial for big move.
Stoch 1day looks fantastic
DGB now sit inside triangel on big supports
Volatility this year is smaller and smaller
In 2018 there was a few big moves from 250 to 520sat, 330 to 650sat, what next?
In charts I think that will be move inside the triangel to:
1.target 370-390sat
2. target 430-450sat
I get alert to 320sat if will be break down, after situation I can get stoploss. DigiByte I have for longterm hodl, thats why get stoploss by situation.
But now will be two strong months in cryptomarkets,
so there is possible scenario that we break up triangel and we can look so much higher than 450sat.
Thank you for your likes, comments and follows.
I will be update situation.

DGB on a tipping point of a breakout here.AFter long bearish cyle of DGB it seems it can break very nicley here.
TOday it got listed on bitfinex and got a little nudge .
You can enter trade keep in mind the yellow line if it breaks below that then exit.
All the best :)


Ideas for possible correction.Do not use any chart as an investment advice.
. If you have any ideas you can share by leaving in comments.
. Possible correction of DGB. Levels of purchase.
. If the DGB -5.75% long-term support is unable to insure we will see retests in the next levels marked on the chart.
. I hope this chart helps you get more DGB heritage or keep your BTC.

DGB "A Beginning"Here we are in Strong Support Zone. You can buy on 340-345sat.
Sell Targets will be,
i- 370-374
ii- 395-403

DIGIBYTE, DGB/BTC (BITTREX) Trade Opportunity!DIGIBYTE is in a descending channel however I see a possibility of a reversal with DGB. We have EWO showing bullish divergence. STOCH moving from oversold area. DEMARKER is going from low demand to high demand which is another bullish sign. We have had a dump to 0.00000323 area and bounced from there so a double-bottom to that area before going up has a strong possibility. So, we have our indicators showing bullish signals and a possibility of bullish pattern. So now we have to just wait for DGB to exit this descending channel(red line) and EMAs to squeeze.
Good Luck, Traders! #moon #mooncommunity #turtlestyletrading ;)
Be a turtle my friend © Farhad Jafarov
