DGB/USDT – Preparing for a Rebound from a Historical Demand Zone
🔍 Pattern and Structure Analysis
The DGB/USDT pair is currently testing a historical demand zone in the 0.00550 – 0.00733 USDT area (highlighted in yellow). This zone has proven to be a strong bounce area since mid-2022. The price structure is forming a large double bottom in this support zone, indicating a potential medium- to long-term bullish reversal pattern.
🟢 Bullish Scenario
If the price successfully holds and bounces from this support:
Short-term targets: 0.00832 – 0.01067 USDT
Mid-term targets: 0.01343 – 0.01807 USDT
Long-term targets: 0.03207 – 0.03845 USDT
This potential upside is supported by an emerging early-stage parabolic move, as illustrated by the yellow projection arrow. If volume increases and market sentiment improves, we may see a multi-wave recovery pattern unfold.
🔴 Bearish Scenario
However, if the price breaks down below the key support at 0.0055 USDT:
It may retest the all-time low around 0.00500 USDT
Such a breakdown would invalidate the long-standing support structure and may lead to further downside pressure
🧩 Pattern Summary
Pattern: Double Bottom / Accumulation Zone
Timeframe: 1W (Weekly)
Current Sentiment: Neutral to Bullish, depending on confirmation of a rebound from the yellow zone
🧠 Additional Notes
This accumulation zone may present a valuable opportunity for swing traders or long-term investors looking for entries at undervalued levels. However, it's crucial to wait for volume confirmation and a strong reversal candlestick pattern before entering.
#DGB #DGBUSDT #AltcoinAnalysis #CryptoWeekly #DoubleBottom #SupportZone #ReversalPattern #CryptoSignals
DGBUSDT trade ideas

DGBUSDT 1W AnalysisDGB ~ 1W Analysis
#DGB Buy back gradually from this support block with a short term target of at least 20%+ from here.

SPOT DGB LONG 12.06.2025Pinning after abnormal purchases.
💰I enter at the market price.
I'll let you know when I record it manually.
‼️Risk per trade: 1% of the allocated funds for spot trading.
Thank you!
DigiByte 3 Years Consolidating; New All-Time High In Dec. 2025June 2022, literally. Actually, in May 2022 DigiByte enters the current price range. In fact, the low in May 2022 was the exact same price we have now. This means three full years of sideways action, consolidation.
This sideways action is not a bearish development but bullish. The only time when volume produced a significant rise was in November 2024 and it was all bullish. This is the whales accumulation zone. Late last year the whales started to accumulate for what will happen later this year.
Also notice that the correction in 2025 ended as a higher low compared to the low in early November 2024. This is all bullish but also all long-term based. This is not for the faint of heart. Patience is key. Big profits are possible for those who wait.
A new all-time high is possible. In 2020-2021 the bull market lasted a little more than 400 days. Total growth amounting to 7,118%. The bottom happened in March 2020. You can see this on the chart as "market bottom."
The same dynamics this time around would put a new all-time high around December 2025. We take the bottom in November 2024 and add up 413 days. A new all-time high is possible because we have a long-term higher low.
Patience is key. Many pairs are in a similar situation. A bull market happens every 4 years in Crypto. 2013 » 2017 » 2021 » 2025.
Thanks a lot for your continued support.
Namaste.

DGB 2nd breakout Successfully breakout this resistant line with a short -term target of at least +10%

DigiByte Will Launch The 2025 Bull Market (2,753% Or 4,479% ???)Just for context. After a strong decline between mid-2019 and March 2020, DigiByte produced a 7,000%+ bullish wave. The cycle peaked in April 2021 and the rise had a duration of 413 days. A year and two months.
This info opens up some questions and gives fuel for some speculation:
» Will DigiByte grow for 3 months and that's it?
» Will it grow for 6 months and then retrace and start a four years long bear market?
» Will DigiByte grow for more than a year as in the last bull market cycle?
» Will this cycle be different because market conditions are different?
» Will DigiByte grow straight up for 2-3 years or more?
DigiByte has been closing green four weeks straight —Alert!
This is a bullish signal that cannot be ignored. While the entire market was producing a major bottom just a week ago, DGBUSDT was consolidating up. Alert!
The market bottom was hit in November 2024.
DigiByte is still trading within a wide sideways channel but the signals are bullish for a breakout.
Four weeks green while moving higher. Trading volume rising significantly.
The entire Altcoins market already bottomed and preparing to grow.
Alert! Let's keep it simple. DigiByte is set to grow.
Now, how far up can it go?
Market conditions are so different now compared to four years ago... But, let's go by past action. If DGBUSDT were to grow for an entire year, a new All-Time High can be hit in November 2025. That's the trick. If prices start rising today, it doesn't count as the start of the bull market, the start counts from the last major low.
So November 2025 is the best approximation, just a map, give or take a few months. December 2025, January 2026, February 2026 who knows... Or maybe October 2025.
Late 2025 is the main date to look for very high prices. New All-Time Highs all across.
Prepare and be ready.
This is a friendly reminder...
Alert!
Namaste.

DigiByte Will Be A Market Leader (Top Performer) —Obey Me!Maybe you don't believe me or you disagree; do not argue with me, just listen to what I say. Grasp the meaning of my words; logic, understand.
This is the signal. DigiByte (DGBUSDT) tends to move first and it is already moving ahead. It closed green last week after some shakeouts while producing a local higher low. This week is green after a very strong shakeout, and the current session is a hammer candlestick pattern pointing straight up.
Do not argue with me. You are the student, I am the Master of the charts.
Just hear what I say. See it, feel it, grasp it; understand.
There is no point in arguing with me or with the market. I am an expression of the Cryptocurrency market. I am the Spirit of trading and the materialization of Bitcoin's soul. I have the divine eye, and I am telling you that the Altcoins market is about to grow really strong.
I don't care about what you think or believe. It has no relevance to me. I will be right and you will be wrong. If you think the market is going down, you are wrong. If you agree with me, you will be right, do not argue anymore.
DigiByte tends to move first and the signals are in. Two weeks straight prices are green. When it breakouts and starts to grow, you will be thinking, "Why did miss this one?" "How come I didn't see it?" You saw it when I published my chart.
What will you do now?
Will you trust and adapt to change?
Will you continue to doubt and let this endless stream of opportunities to run away.
I am here to stay. Crypto is going up.
This is the signal. The signals are always coming from the charts.
I have the balls to say it publicly, I am right, you are wrong. If you are bearish of course.
If you are bullish, welcome to the club.
You are wise and smart. Together we will grow.
When the market turns, we will welcome you with open arms even though you will be a bit late. It doesn't matter, we all make mistakes. But you have the chance to skip this one, just do as I say. Buy and hold.
Namaste.

#DGB/USDT#DGB
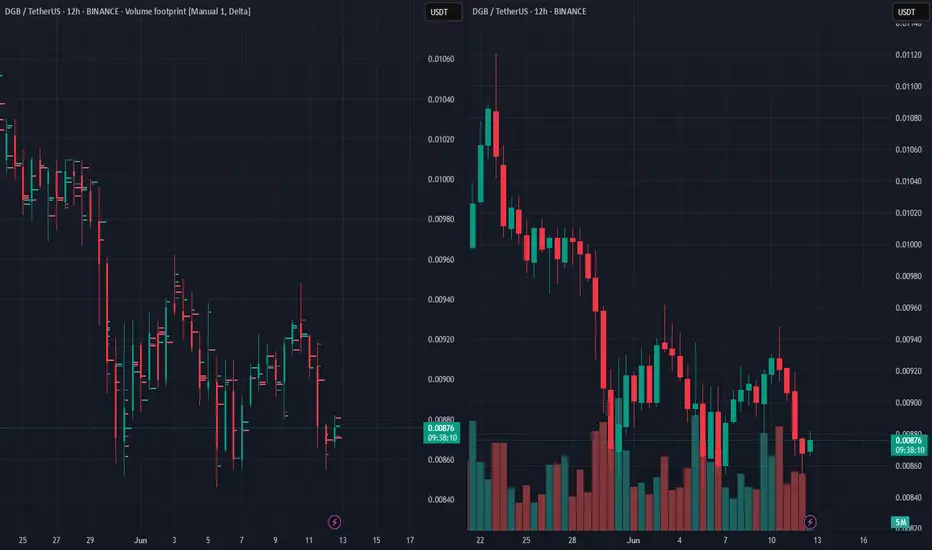
The price is moving within a descending channel on the 1-hour frame and is expected to continue lower.
We have a trend to stabilize below the 100 moving average once again.
We have a downtrend on the RSI indicator, supporting the upward move with a break above it.
We have a resistance area at the upper limit of the channel at 0.00906.
Entry price: 0.00894
First target: 0.00863
Second target: 0.00831
Third target: 0.00797

DGBUSDT 4hourPrice is currently moving in a falling channel which RSI has broke out. Buy signal has printed in 2 hour time frame. A good long opportunity to target channel high in short term.
Manage your risk and always use stoploss.

Long Entry Signal for DGB/USDT DigiByteMLR Nearing SMA: The MLR (blue) is below but approaching the SMA (pink), hinting at a potential bullish crossover.
MLR > BB Center: MLR exceeds the Bollinger Bands Center Line (orange), signaling growing bullish momentum.
PSAR: PSAR dots (black) are below the price, supporting an uptrend.
Price > SMA 200: Price is above the 200-period SMA (red), indicating long-term bullish strength
Trade Idea:
Entry: Consider a long position at the daily close.
Stop Loss: Place SL at yesterday’s PSAR level to limit downside risk.
Follow Me: Follow me for exit or profit-taking opportunities.
Outlook: MLR is poised to take SMA, which could confirm a bullish surge alongside PSAR and BB support. Stay vigilant for the crossover or reversal signals.
Risk Warning: Not financial advice, trade at your own risk.

DGB DGB / USDT
1D time frame
analysis tools
____________
SMC
FVG
Trend lines
Fibonacci
Support & resistance
MACD Cross
EMA Cross
______________________________________________________________
Golden Advices.
********************
* Please calculate your losses before any entry.
* Do not enter any trade you find it not suitable for you.
* No FOMO - No Rush , it is a long journey.
Useful Tags.
****************
My total posts
www.tradingview.com

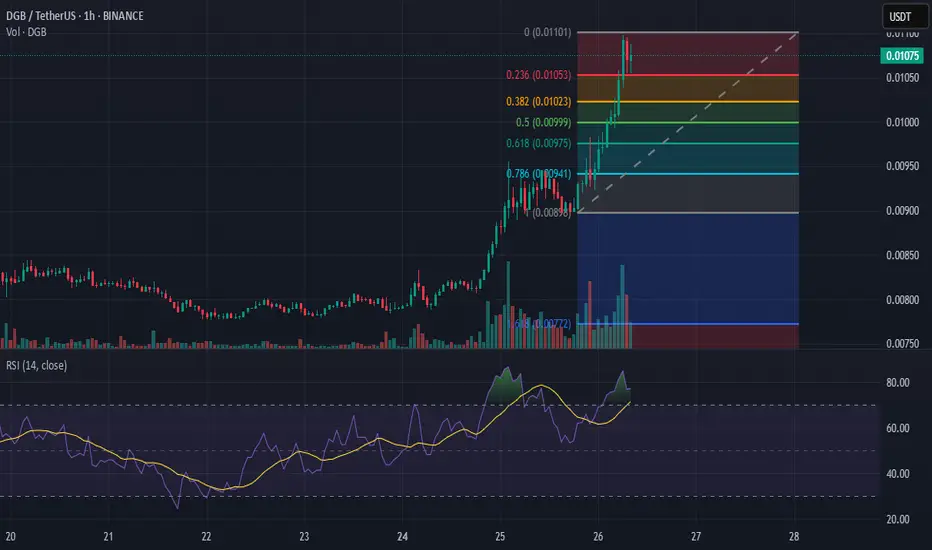
DGB/USDT Technical Analysis: Fibonacci Levels and RSI InsightsThe DGB/USDT pair on Binance is currently in a strong uptrend, as seen in the 1-hour chart. The price has surged, breaking key resistance levels and reaching 0.01078 USDT. The Fibonacci retracement levels suggest potential support at 0.618 (0.00975) and 0.5 (0.00999), which could act as buy zones if a pullback occurs. Additionally, the Relative Strength Index (RSI) is at 77.69, indicating overbought conditions, which might lead to short-term consolidation or correction. Traders should watch for volume confirmations and consider setting a trailing stop-loss to lock in profits while monitoring potential retracement levels.
Good moment for Buy DGBGood moment for Buy DGBUSDT We see the sideways channel borders widening. I think we will test the upper level again now. Good risk to reward ratio. Will see...
dgb breaking consolidation expecting 2x bullish wave after long consolidation finally dgb breaking falling wedge, dgb have another horizontal resistance, once both resistances got cleared, dgb can give solid rally after that, i,m expecting minimum 2x after successful breakout.

DGBUSDT(DigiByte) Updated till 08-03-25DGBUSDT(DigiByte) Daily timeframe range. we can see a steady move from its local low till now. trying to stay above 0.01028 as volume is decent here if it can than it can push further levels. if 0.01028 fails than back to local low.

DGB ANALYSIS🔮 #DGB Analysis - Breakout 🚀🚀
💲💲 In daily time-frame,Falling Wedge Pattern is forming and a good breakout is done. And a small retest is done, now we would see a good reversal move in #DGB ✅ 💯🚀
💸Current Price -- $0.00955
📈Target Price -- $0.001544
⁉️ What to do?
- We have marked crucial levels in the chart . We can trade according to the chart and make some profits. 🚀💸
#DGB #Cryptocurrency #Breakout #DYOR

DGBUSDT UPDATEDGBUSDT is a cryptocurrency trading at $0.00926. Its target price is $0.01500, indicating a potential 70%+ gain. The pattern is a Bullish Falling Wedge, a reversal pattern signaling a trend change. This pattern suggests the downward trend may be ending. A breakout from the wedge could lead to a strong upward move. The Bullish Falling Wedge is a positive signal, indicating a potential price surge. Investors are optimistic about DGBUSDT's future performance. The current price may be a buying opportunity. Reaching the target price would result in significant returns. DGBUSDT is poised for a potential breakout and substantial gains.

DigiByte Update & 2025 Bull-Market Dynamics (8 Months Bullish) DigiByte's bull-market can develop in a period of 8 months. DGBUSDT can produce 3 months of growing prices followed by a 2 months long correction, after the correction bottom ends as a higher low we get 3 additional months of bullish action and this produces the final peak in late 2025. This is a rough estimate.
Coming from this perspective, we can expect the initial wave to take some time to develop. Something like bullish consolidation. We would see slow and steady growth for 1-2 months and then a major burst forward. This is how the market normally tends to behave.
Right now we are seeing a small bullish breakout from a falling wedge pattern but it is easy to notice that the trading volume is low. This is a start but it can take a while for bullish momentum to grow.
If you would like to see the 2025 ATH targets and projections, just visit my profile and search for DGBUSDT using the search filter, this will give you several publications with long-term targets.
Thanks a lot for your continued support.
DGBUSDT is now trading within a long-term higher low. Higher lows since July 2024. Expect strong action to be present by May. There will be lots of growth, lots of fun and tons of profits.
Thank you for reading.
Namaste.

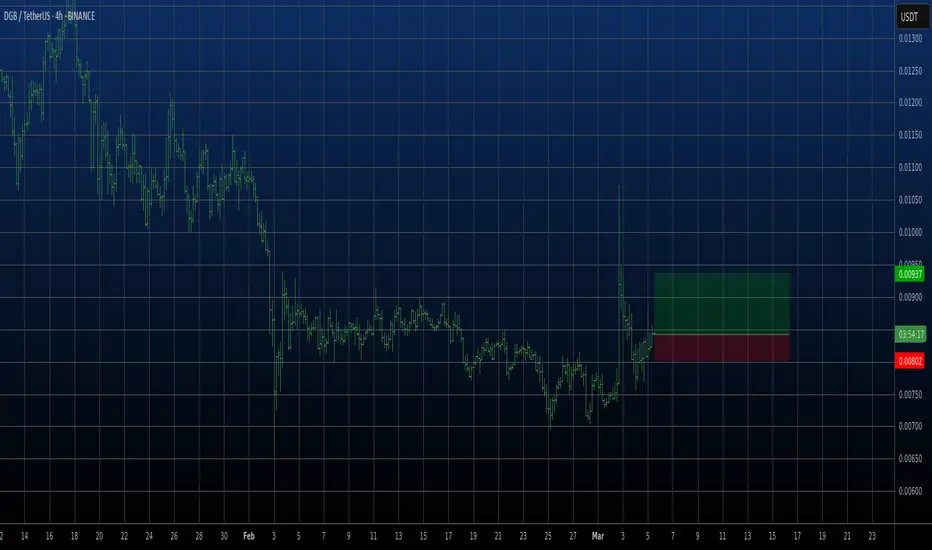
SPOT DGB LONG 26.02.2025Pinning after abnormal purchases.
💰I enter at the market price.
I'll let you know when I record it manually.
‼️Risk per trade: 1% of the allocated funds for spot trading.
Thank you!

Prepare to BUY Spot DGBUSDT (2025 Growth Pick)🚀 Prepare to BUY Spot DGBUSDT (2025 Growth Pick)
🌟 DGBUSDT has been accumulating strongly – Ready to break out in 2025! 🌟
🌍 Market Overview:
DGBUSDT has undergone a solid accumulation phase, showing signs of strong support and upcoming breakout potential. The 2025 market cycle could be the perfect moment for a significant price surge.
📊 Trade Plan:
📌 Entry Point:
$0.09 or as low as possible – Ideal accumulation range.
🎯 Target:
$0.7 – Aiming for a strong breakout in the upcoming market cycle.
⏳ Hold Time:
Throughout 2025, aligned with the expected long-term trend.
💡 Note:
Focus on accumulating within the suggested price range.
Keep an eye on key technical confirmations and overall market sentiment.
Patience and strategic positioning will be crucial for maximizing gains.
🔥 DGBUSDT is gearing up for a big move – Secure your spot now before the breakout! 🔥

SPOT DGB LONG 21.01.2025Pinning after containment of sales.
🎯Purpose:
0.01616
I'll let you know when I record it manually.
‼️Risk per trade: 1% of the allocated funds for spot trading.

$DGBHere's a potential set up for EURONEXT:DGB
Its on a significant support potentially forming a harmonic pattern.

#DGB (SPOT) IN ( 0.01000- 0.01400) T.(0.05900) SL(0.00963)BINANCE:DGBUSDT
#DGB / USDT
Entry ( 0.01000- 0.01400)
***** Wait for the price to come to entry range *****
SL 1D close below 0.00963
T1 0.03200
T2 0.04400
T3 0.05900
2 Extra Targets(optional) in chart, if you like to continue in the trade with making stoploss very high.
______________________________________________________________
Golden Advices.
********************
* collect the coin slowly in the entry range.
* Please calculate your losses before the entry.
* Do not enter any trade you find it not suitable for you.
* No FOMO - No Rush , it is a long journey.
Useful Tags.
****************
My total posts
www.tradingview.com
**********************************************************************************************
#Manta #OMNI #DYM #AI #IO #XAI #ACE #NFP #RAD #WLD #ORDI #BLUR #SUI #VOXEL #AEVO #VITE #APE #RDNT #FLUX #NMR #VANRY #TRB #HBAR #DGB #XEC #ERN #ALT #IO #ACA #HIVE #ASTR #ARDR #PIXEL #LTO #AERGO #SCRT #ATA #HOOK #FLOW #KSM #HFT #MINA #DATA #SC #JOE #RDNT #IQ #CFX #BICO #CTSI #KMD #FXS #DEGO #FORTH #AST #PORTAL #CYBER #RIF #ENJ #ZIL #APT #GALA #STEEM #ONE #LINK #NTRN #COTI #RENDER #ICX #IMX #ALICE #PYR #PORTAL #GRT #GMT #IDEX #NEAR #ICP #ETH #QTUM #VET #QNT #API3 #BURGER #MOVR #SKL #BAND #ETHFI #SAND #IOTX #T #GTC #PDA #GMX #REZ #DUSK #BNX #SPELL #POWR #JOE #TIA #TFUEL #HOT #AVAX #WAXP #OGN #AXS #GALA #ONE #SYS #SCRT #DGB
