DJI trade ideas

US30: Short setup brewingSitting in a rising wedge with bearish divergence after running into resistance at 43100, the US30 contract finds itself at an interesting juncture on the charts. If it can’t stage a definitive break above these levels, a short setup could be on the cards.
If the contract cannot break and hold above 43100, traders could look to initiate short positions targeting the 200-day moving average initially. If that were to give way, the target could be lengthened to 42000, where wedge support is currently found. A stop above 43100 would protect against reversal.
While MACD has staged a bullish crossover, the momentum signal is countered by what’s still bearish divergence between RSI (14) and price despite the latest bounce.
Given the proximity to month end—a period notorious for window dressing and false signals—the preference would be to wait for another retest and failure at 43100 before initiating the trade.
A de-escalation in trade tensions, lower crude prices and the prospect of a Fed rate cut as soon as July have been tailwinds for the contract over recent days. If it can’t continue to rally in this environment, it questions just what would be required to deliver further upside, just as negative tariff headlines potentially loom.
Good luck!
DS

Dow Jones Entry - Riskier this one trade keep the SL way tighter than the other, guarantees a much better RRR but it is more risky

Dow Jones Entryprice already was reacting off of a Order Block formed on the one hour, so i got down to the m5 and started searching for an entry, unluckily i lost the good one but there is still the possibility to do something good and safe like this.

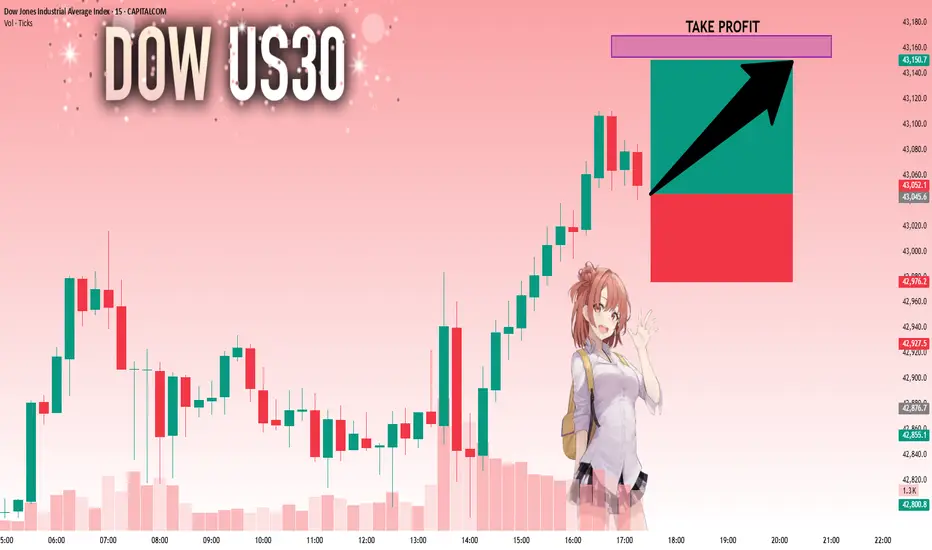
Bullish bounce for the Dow Jones?The price is falling towards the pivot which has been identified as an overlap support and could bounce from this level to our take profit.
Pivot: 42,588.80
1st Support: 42,119.27
1st Resistance: 43,222.33
Risk Warning:
Trading Forex and CFDs carries a high level of risk to your capital and you should only trade with money you can afford to lose. Trading Forex and CFDs may not be suitable for all investors, so please ensure that you fully understand the risks involved and seek independent advice if necessary.
Disclaimer:
The above opinions given constitute general market commentary, and do not constitute the opinion or advice of IC Markets or any form of personal or investment advice.
Any opinions, news, research, analyses, prices, other information, or links to third-party sites contained on this website are provided on an "as-is" basis, are intended only to be informative, is not an advice nor a recommendation, nor research, or a record of our trading prices, or an offer of, or solicitation for a transaction in any financial instrument and thus should not be treated as such. The information provided does not involve any specific investment objectives, financial situation and needs of any specific person who may receive it. Please be aware, that past performance is not a reliable indicator of future performance and/or results. Past Performance or Forward-looking scenarios based upon the reasonable beliefs of the third-party provider are not a guarantee of future performance. Actual results may differ materially from those anticipated in forward-looking or past performance statements. IC Markets makes no representation or warranty and assumes no liability as to the accuracy or completeness of the information provided, nor any loss arising from any investment based on a recommendation, forecast or any information supplied by any third-party.

There is a possibility of a decline and a return to the channelIn compressed channels
The price can hardly pass it
Therefore, the downward trend is expected to continue
In this time form.
The details of the deal have been specified.
good luck. BLACKBULL:US30 BLACKBULL:US30

US30 - Entries ActiveAs anticipated got the sweep below then break above our area with a U shape formation. Looking to the upside.
TOP IS NOT IN YET (MORE UPSIDE AFTER THE MINOR CORRECTIONS)We discussed the 5-year bull cycle that starts off every 20-year cycle. We identified that the current 5-year bull cycle will be one of the wildest in the history of the DJIA market by virtue of the current energy level within the log expansion. We will start a new progressive series to discuss the current 20-year cycle in motion.
First we will look closely at these three different 20-year cycles
From the three cycles we can identify a peculiar recurring structure, that is, after the approximately 5th year top we have a wild decline that averagely bottoms below the starting price. We will not dwell much on this cycle as it's not the current cycle in progress. Between these cycles is an (Alternate Cycle) that also has a similar fractal construction.
The first two alternate cycles directly lie between the cycles identified earlier and have a similar fractal. The most striking identity of these alternate cycles is that the origin point is the lowest point within the 20 year trend. The correction from the 5th year top is not so steep and never goes below the origin
The 1942/1962 cycle lies between the 1921/1942 and 1962/1982 cycles
The 1982/2002 cycle lies between the 1962/1982 and 2002/2022 cycles
This means the next alternate 20-year cycle is the 2022/2042 cycle which will lie between 2002/2022 and 2042/2062 cycles. From the internal construction of this cycle we can dive deeper and model the structure forward in both price and time. Example, the vertical price axis for the 1942/1962 cycle was (+648.61 pts) and total horizontal time elapsed was (+1052 wks).
We have a (648.61 x 1052) structure showing a perfect golden ratio of price and time
(1052 / 648.61) = 1.6219
1982/2002 cycle had price axis = 1098.03 pts and time = 1052 wks
We have approximately a 1098.03 x 1052 square of price and time
By observing the cumulative growth pattern we can make projection of the current cycle in progress. We would go through the growth gradually and identify price and time resistances as price action progresses. Please check back as we build step by step the growth structure of the current cycle.
Trade safe

US30 - Final Push before PullbackPotentially another push to upper levels of supply potentially 43,150-43,200. Can see this retest before seeing a potential pull back based off larger time frame.

Why I’m Sitting Out: US30 Reaches Critical Range HighI’m currently keeping a close eye on the US30, along with the other major indices 🧐. What stands out the most right now is how overextended this rally has become across the board 📈.
The key concern here is that price has now pushed into a previous external range high, sweeping liquidity resting just above that level 💧. This area is a textbook zone where big money often steps in to offload positions — it’s the perfect place for institutions to find willing counterparties after prior accumulation 📍💼.
Given the aggressive nature of this move and how far price has stretched, I’m extremely hesitant to get involved at this stage 🚫. I have zero interest in buying into a market that’s trading at a premium and sitting at a potential reversal zone ⚠️.
The prudent move here is to wait for a retrace, followed by a bullish break in structure before considering re-entry 🔁📈. Sometimes, the most powerful edge in trading is knowing when not to trade — and for me, today is one of those days.
⚠️ This is not financial advice — just sharing my current perspective on the market.

US30 Technical Outlook – 06/25/2025📍 US30 Technical Outlook – 06/25/2025
Big move! 🚀 Price broke out of the 42,054–42,100 consolidation and rallied aggressively into the key 43,100–43,150 resistance zone.
🧠 Key Observations:
Clean bullish breakout above 42,100 ✅
Price now sitting at 43,120–43,150 supply 🛑
EMAs sharply turned bullish (42,808 and 43,038 levels)
📊 Key Price Zones:
🔼 Major Resistance: 43,150 → 43,300
🔽 Support: 42,800 → 42,600 → 42,100
📈 Trade Setup Ideas:
🔹 Long Bias:
Pullback into 42,800–42,600 support
→ Look for bullish structure & continuation signals
→ Target: 43,150 → 43,300
🔻 Short Bias:
Look for strong rejection candles at 43,150–43,300
→ Intraday scalp short back toward 42,800
→ Break below 42,800 could target 42,600 or even 42,100
‼️ Momentum is clearly bullish for now, but this is a major supply zone so caution on chasing late longs.

Dow Jones breakout targets 44K and beyondThe Dow Jones is finally breaking out, and the chart suggests a 3 to 4 percent move higher is in play. We analyse the key patterns, trade setups, and risks ahead including market seasonality, war headlines, and economic data. Bitcoin, EURUSD, and Nasdaq also showing strength. Is this the start of a bigger rally?
This content is not directed to residents of the EU or UK. Any opinions, news, research, analyses, prices or other information contained on this website is provided as general market commentary and does not constitute investment advice. ThinkMarkets will not accept liability for any loss or damage including, without limitation, to any loss of profit which may arise directly or indirectly from use of or reliance on such information.

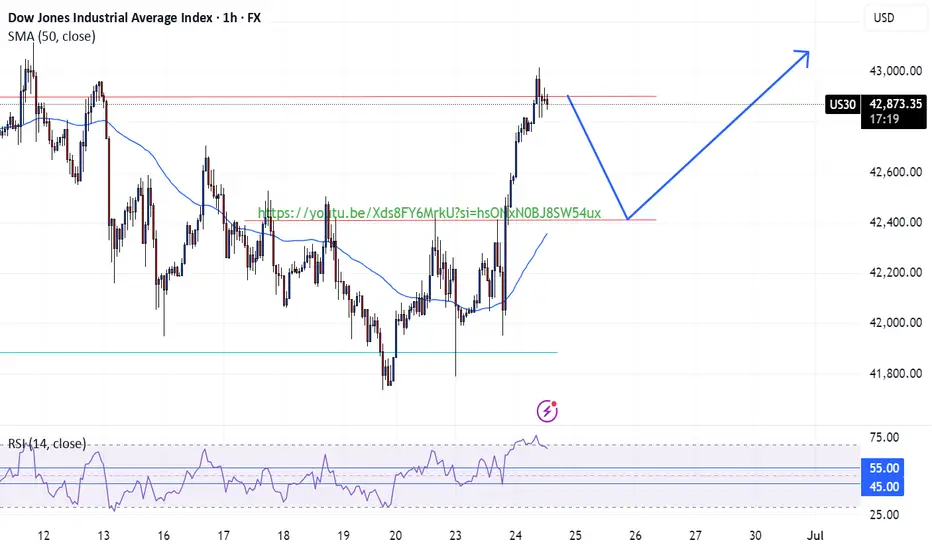
US30 on Track for 43KHappy Monday, traders.
Here’s my latest analysis and trade idea for US30. Since April 6th, US30 has been in a strong bull run, breaking above the descending weekly trend line while continuing to print higher highs and higher lows.
Although price action has shown some uncertainty since May 22nd, the bigger picture remains bullish it’s just noise. The trend is intact, and we’re now pushing back above the 50 EMA.
Currently, US30 is forming a wedge between two descending trendlines I’ve marked on the chart. I expect some consolidation within this structure, with a potential pullback into my entry zone.
From there, I’m anticipating another short-term push higher, with a target in the Golden Zone between 43,100 and 43,400 . My entry range is between 42,179 and 42,481 , with a stop-loss just below the current swing low at 41,980.
I expect this move to develop sometime within the next couple weeks.
What do you think will it play out? Let me know in the comments.
PEPPERSTONE:US30

us30 analysis 25-06-2025There was engulfing in the 4 hour candle and the next candle was a shooting star. So there is a lot of liquidity in the previous engulfing. So the market can come to 22092 to grab this liquidity. However, to take an entry, you should take confirmation of lower time frames like 1 minute, 5 minutes.

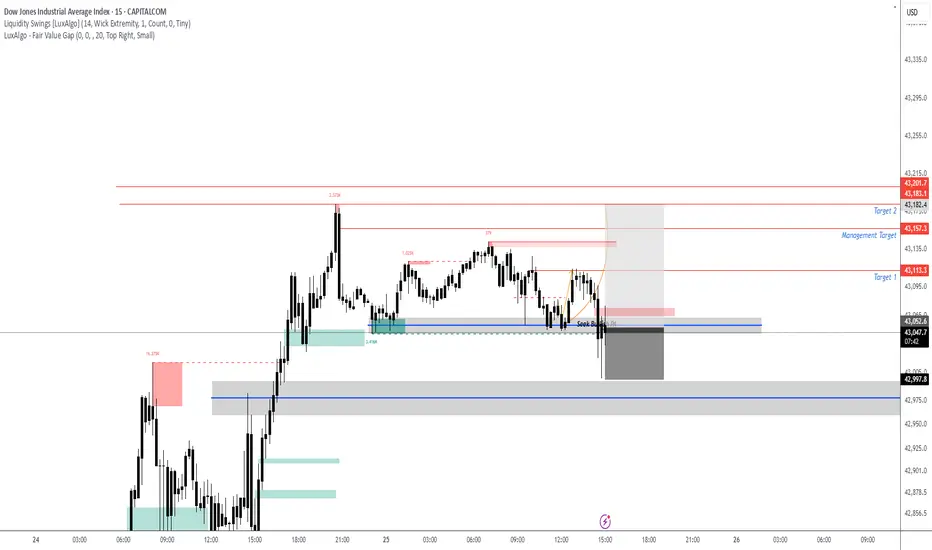
US30: The Market Is Looking Up! Long!
My dear friends,
Today we will analyse US30 together☺️
The price is near a wide key level
and the pair is approaching a significant decision level of 43,045.6 Therefore, a strong bullish reaction here could determine the next move up.We will watch for a confirmation candle, and then target the next key level of 43,152.9.Recommend Stop-loss is beyond the current level.
❤️Sending you lots of Love and Hugs❤️
short within and without rangesbasicly i dont know what will happen
do i predict?
yes
do i react?
maybe

US30 ShortElite Live Analysis – US30
Market Structure: Bearish across the Weekly, Daily, and 4H timeframes.
Key Level: Price has tapped into a significant zone, aligning with higher timeframe bias.
1H Confirmation: Price also tapped into a 1H Order Block and showed clear rejection, further validating downside potential.
Expectations:
Anticipating a strong move to the downside in alignment with market structure.
Targets:
Structured liquidity resting below
Liquidity pools beneath current price

DowJones INTRADAY key trading levelsKey Support and Resistance Levels
Resistance Level 1: 43200
Resistance Level 2: 43550
Resistance Level 3: 43900
Support Level 1: 42240
Support Level 2: 41740
Support Level 3: 41280
This communication is for informational purposes only and should not be viewed as any form of recommendation as to a particular course of action or as investment advice. It is not intended as an offer or solicitation for the purchase or sale of any financial instrument or as an official confirmation of any transaction. Opinions, estimates and assumptions expressed herein are made as of the date of this communication and are subject to change without notice. This communication has been prepared based upon information, including market prices, data and other information, believed to be reliable; however, Trade Nation does not warrant its completeness or accuracy. All market prices and market data contained in or attached to this communication are indicative and subject to change without notice.

DOW JONES about to skyrocket based on the Gold/Silver ratio!Dow Jones (DJI) has been basically consolidating for the past month or so, following the massive April 7th bottom rebound but there is a very distinct indicator that shows it is about to skyrocket.
That is the Gold/ Silver ratio (blue trend-line). Gold (XAUUSD) as a safe haven, attracts capital in times of market uncertainty. Silver (XAGUSD), as a metal of industrial use, attracts capital in times of economic boom and prosperity.
In the past 6 years more particularly, every time the Gold/ Silver ratio declined, Dow started rising aggressively (exception July-Aug 2019, when the market rose straight after), as investors clearly showed their risk-on appetite by buying Silver (optimism) at the expense of Gold (fear).
Dow's current consolidation indicates that there may be high accumulation in the past month and the ratios extended decline suggests a skyrocket move is up next.
-------------------------------------------------------------------------------
** Please LIKE 👍, FOLLOW ✅, SHARE 🙌 and COMMENT ✍ if you enjoy this idea! Also share your ideas and charts in the comments section below! This is best way to keep it relevant, support us, keep the content here free and allow the idea to reach as many people as possible. **
-------------------------------------------------------------------------------
💸💸💸💸💸💸
👇 👇 👇 👇 👇 👇

dji looking to rebound after 2 days on the rough marketThe fib circle looks to be showing an upward trend. Notice how the blue circle is completely overtaken and the drop yesterday. Showing that a potential reversal is within both levels. Seeing how this formation is. Looking to be on a continuous volatility for the djia.
If someone could look at this and if you would, I ask for an opinion?

US30 Long Opportunity US30 shows strong bullish confluences at the opening of the week, currently testing the resistance level at 42,900. Price is above above the 50 SMA and favors bullish momentum per the RSI above 55.
Potentially retracement towards the break and retest level at 42,400 where we could see a potential continuation of the bullish trend after the market collects enough liquidity.
This is support by fundamentals of the day being the cease fire between Iran-Israel. investor more comfortable taking risks and stepping back into the indices.
The Dow Jones Index reboundsUS indices rebounded following the US president’s announcing a ceasefire deal in the Middle East, which brought some optimism to the markets and among investors, positively impacting US markets in particular.
The Dow Jones Index rose at the start of this week by approximately 2.62%, reaching a new high above the 42,711 level, which represents the last lower high recorded by the market. A breakout above this level could indicate a shift in trend from bearish to bullish.
If the price pulls back to the 42,025.62 level, it would be considered a corrective move, with a possible upward rebound from that level aiming to target 42,719.99 and potentially continue the bullish trend in the long term.
However, if the price falls below the 41,755.45 level and a four-hour candle closes below it, the positive scenario mentioned above would be invalidated.

Dow Jones eyeing a breakout as war fears de-escalate!Dow Jones Industrial Average (DJIA) stands at 42,581.78 points, reflecting a 0.9% increase from the previous day. This uptick is attributed to investor optimism following a restrained retaliatory missile strike by Iran on a U.S. base in Qatar, which was perceived as non escalatory. Additionally, comments from Federal Reserve Governor Michelle Bowman suggested support for a potential interest rate cut in July, contingent on sustained low inflation .
The DJIA's performance this year shows a modest gain of 0.1%, underperforming compared to the S&P 500's 2.4% increase and the Nasdaq's 1.7% rise. Notably, the index is approximately 6.4% below its all-time high of 45,073.63 reached in December 2024 .
From a technical perspective, the DJIA is trading just above the 42,000 level, with key support around 41,500 and resistance near 43,000. The index has recently faced challenges breaking through the 42,600 mark, indicating potential short-term volatility. Market participants are closely monitoring upcoming economic data and Federal Reserve decisions, which could influence the index's trajectory in the near term.
For investors, the current environment presents opportunities to assess the DJIA's performance relative to other indices, considering factors such as geopolitical developments and monetary policy expectations.
"The forecasts provided herein are intended for informational purposes only and should not be construed as guarantees of future performance. This is an example only to enhance a consumer's understanding of the strategy being described above and is not to be taken as Blueberry Markets providing personal advice."
