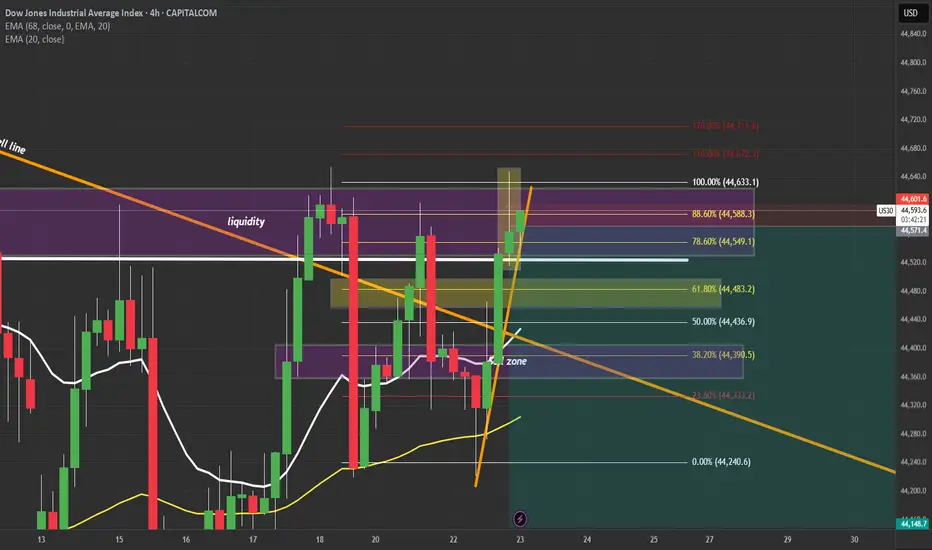
Dow Jones Potential UpsidesHey Traders, in the coming week we are monitoring US30 for a buying opportunity around 44,650 zone, Dow Jones is trading in an uptrend and currently is in a correction phase in which it is approaching the trend at 44,650 support and resistance area.
Trade safe, Joe.
DJI trade ideas

Getting ready for new highs Price tested the 45000 resistance which is the final resistance before new highs, it is now going down to test the trend line support of the uptrend channel
US30 Weekly Forecast – Bullish Bounce or Breakdown?Hope everyone had a great weekend!
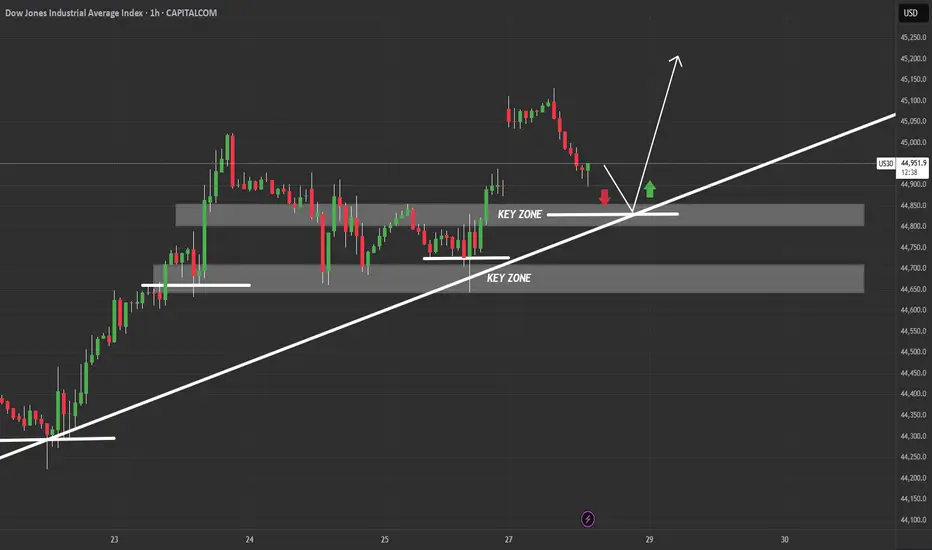
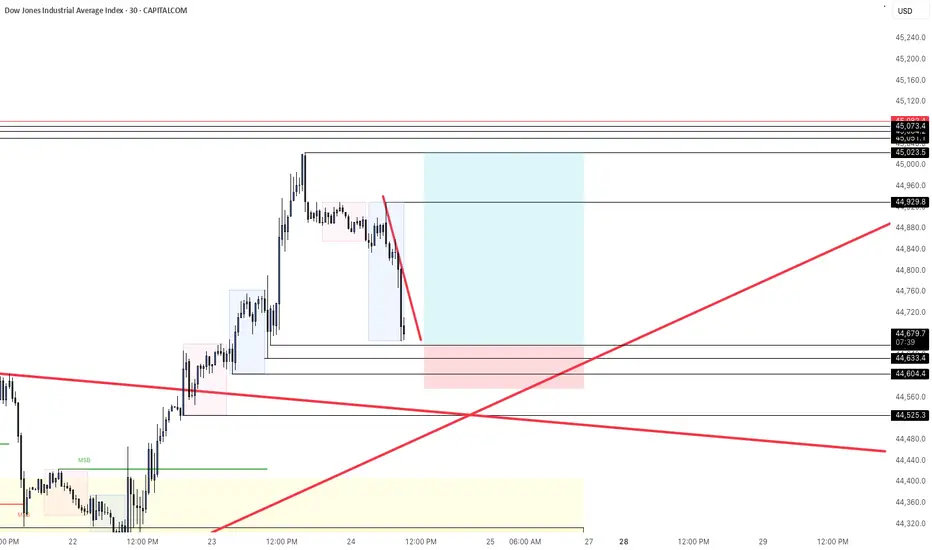
This chart outlines a critical US30 intraday structure with price currently pulling back into a key confluence zone composed of:
A rising trendline from July 23rd
Two stacked demand zones, the upper around 44,850 and lower near 44,700
Bullish Scenario (Preferred Bias):
If price respects the trendline and upper key zone, we may see a bullish continuation targeting the 45,150–45,250 range.
The clean bounce zone, marked by the green arrow, suggests smart money might defend this level.
Watch for bullish engulfing or low-volume traps near 44,850–44,880 to confirm entry.
Bearish Scenario (Alternate Play):
If price fails to hold the trendline, and breaks below the 44,850 key zone with momentum, expect a drop into the lower zone (44,650–44,700).
A breakdown below this lower demand could shift the bias entirely, opening the door for a deeper correction back into the mid-44,000s.
Weekly Playbook:
Early week: Monitor the reaction at the upper key zone for sniper long opportunities with tight stops.
Mid to late week: If structure fails, flip bias and look for supply rejections on retests for shorts.
Risk: Account for FOMC/major U.S. news events that may introduce volatility traps around these zones.
Verdict: Stay patient. Let price dictate bias at the trendline. If it holds, this could be a textbook bounce continuation setup.
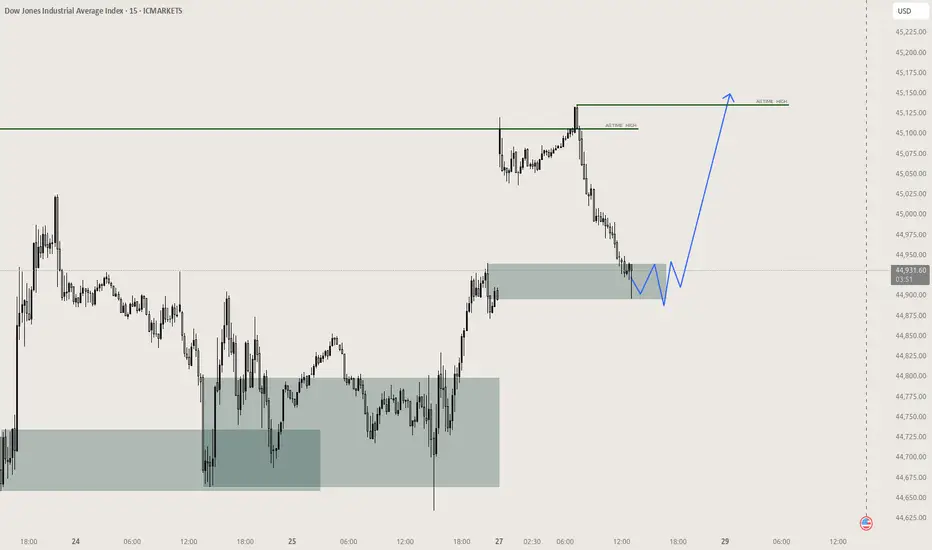
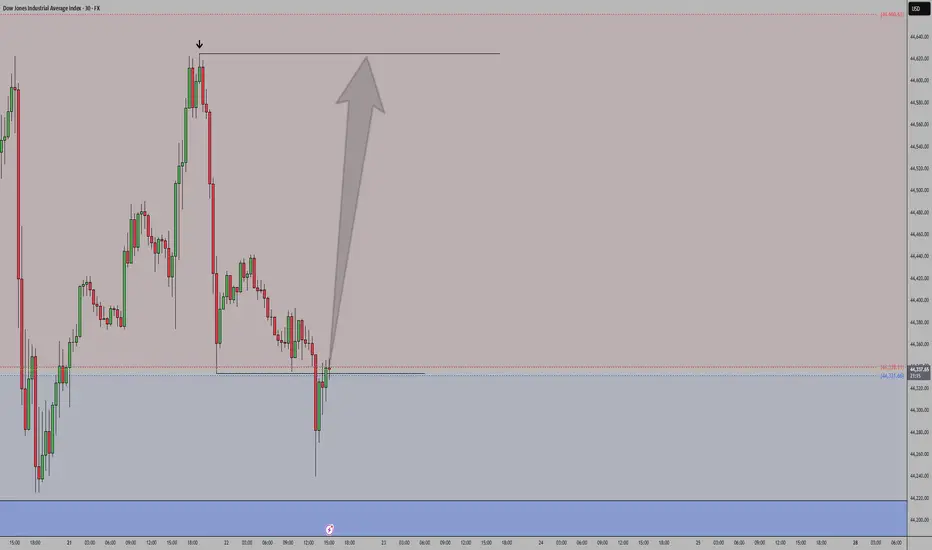
US30 - LONGAfter a huge push to the upside price came down during the asian/London session. Looking for buyers to take over once again and push back to yesterday's highs. Being patient as always and waiting for confirmation around my entry zone.
US30 H4 IdeaThe Federal Reserve meets next week and is widely expected to leave rates unchanged at 4.25%–4.50%. Still, market participants will watch for commentary on inflation and rate-cut prospects, especially after recent criticism of Fed Chair Powell by President Trump.
What Should Traders Watch?
With the major indexes on track for weekly gains, next week’s developments could test the market’s resilience.

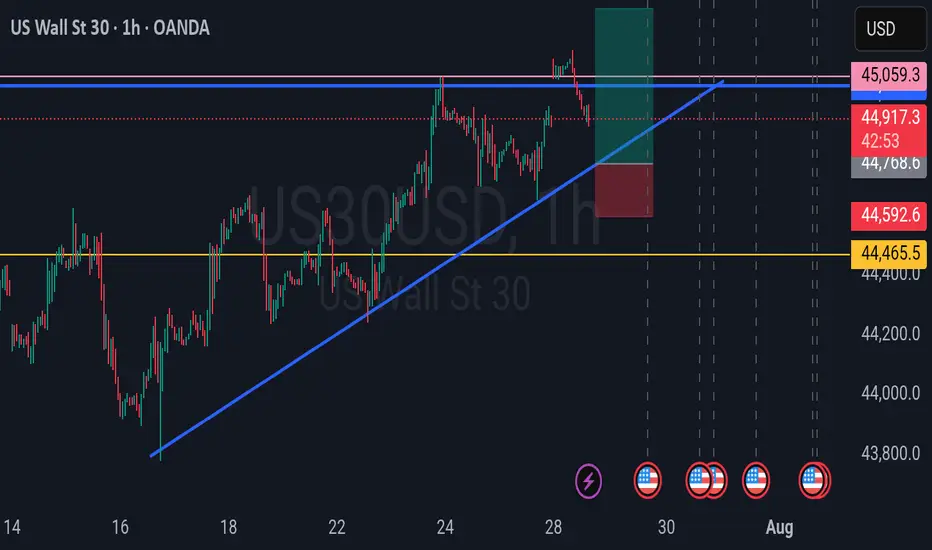
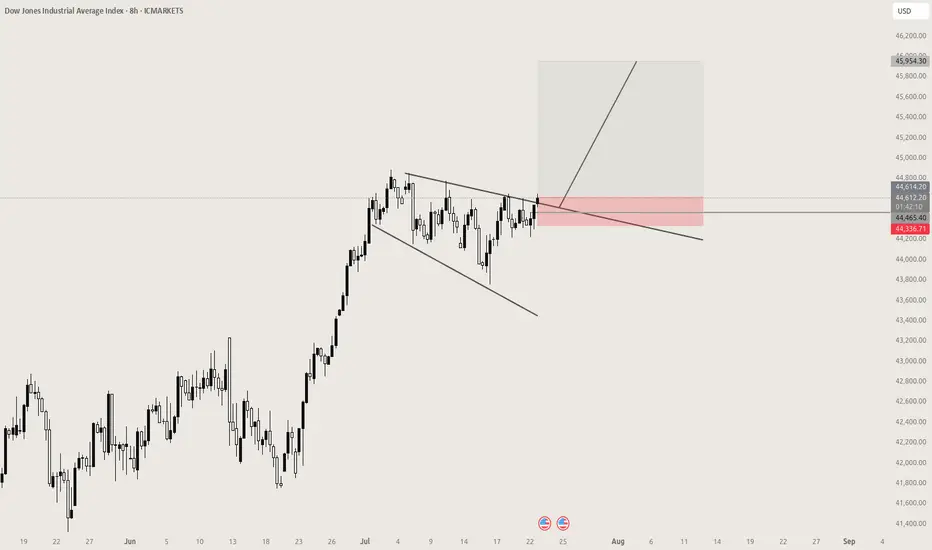
Long Position on Dow Jones Industrial Average
Initiating a long position at 44,456, supported by robust economic data and stronger-than-expected corporate earnings. These indicators point to continued resilience in the U.S. economy, potentially allowing the Federal Reserve to consider rate cuts sooner than previously anticipated — a positive catalyst for equities.
📌 Entry: 44,456
🛑 Stop Loss: 44,207
🎯 Take Profit: 44,900
Monitoring price action closely as market sentiment continues to shift in response to macroeconomic developments.

US30 Hits New All-Time High – What’s Next?US30 | OVERVIEW
The price has printed a new all-time high, exactly reaching our target at 45,090, as previously anticipated.
Today, we may see a correction toward 44,770 and 44,610. If the price stabilizes above these levels, another bullish leg is expected.
On the upside, a break above 44,910 would confirm a bullish continuation toward 45,090 and 45,250.
Key Levels:
Support: 44,770 · 44,610 · 44,370
Resistance: 45,090 · 45,250
previous idea:

US30: Local Bearish Bias! Short!
My dear friends,
Today we will analyse US30 together☺️
The in-trend continuation seems likely as the current long-term trend appears to be strong, and price is holding below a key level of 44,774.9 So a bearish continuation seems plausible, targeting the next low. We should enter on confirmation, and place a stop-loss beyond the recent swing level.
❤️Sending you lots of Love and Hugs❤️

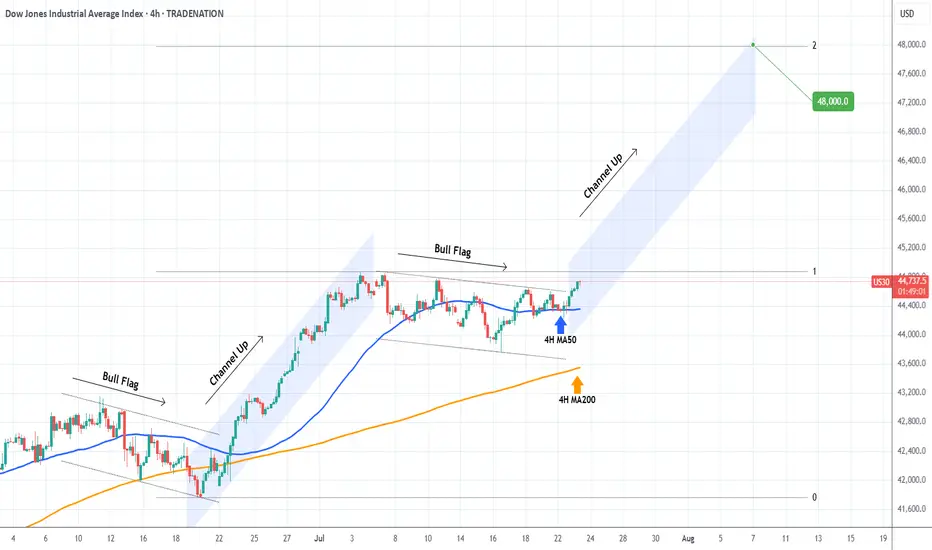
DOW JONES Strong rebound on its 4H MA50.Dow Jones (DJI) is having a strong rebound exactly on its 4H MA50 (blue trend-line). This is taking place just after the price broke above the Bull Flag that served as the accumulation pattern following the previous Channel Up.
This is a repetitive pattern and most likely we will now see the new Channel Up starting. The technical Target on such formations is the 2.0 Fibonacci extension at 48000.
-------------------------------------------------------------------------------
** Please LIKE 👍, FOLLOW ✅, SHARE 🙌 and COMMENT ✍ if you enjoy this idea! Also share your ideas and charts in the comments section below! This is best way to keep it relevant, support us, keep the content here free and allow the idea to reach as many people as possible. **
-------------------------------------------------------------------------------
Disclosure: I am part of Trade Nation's Influencer program and receive a monthly fee for using their TradingView charts in my analysis.
💸💸💸💸💸💸
👇 👇 👇 👇 👇 👇
Dow Set for Volatile Move as Earnings, Tariff Risks CollideUS30 OVERVIEW
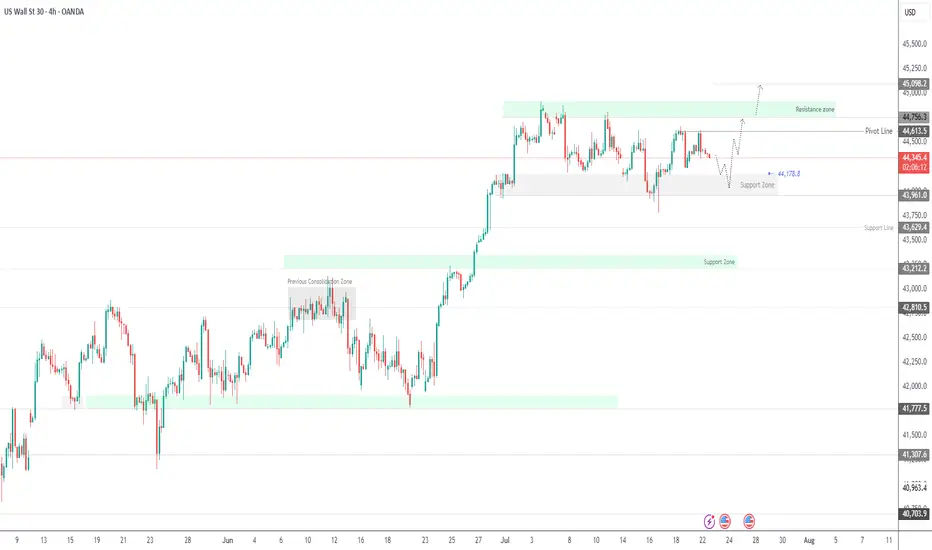
The price is currently consolidating between 44,180 and 44,620, awaiting a catalyst. Today’s earnings reports are expected to heavily influence Dow Jones price action.
If earnings come in strong, the index is likely to push toward 44,620 and 44,760. A confirmed stability above 44,620 would strengthen the bullish case, potentially opening the path toward a new all-time high near 45,100.
However, a break below 44,180 would signal bearish momentum, with potential downside toward 43,960. Additional pressure could come from escalating tariff tensions, further weakening sentiment.
Resistance: 44,620 · 44,760 · 45,100
Support: 44,180 · 43,960 · 43,630

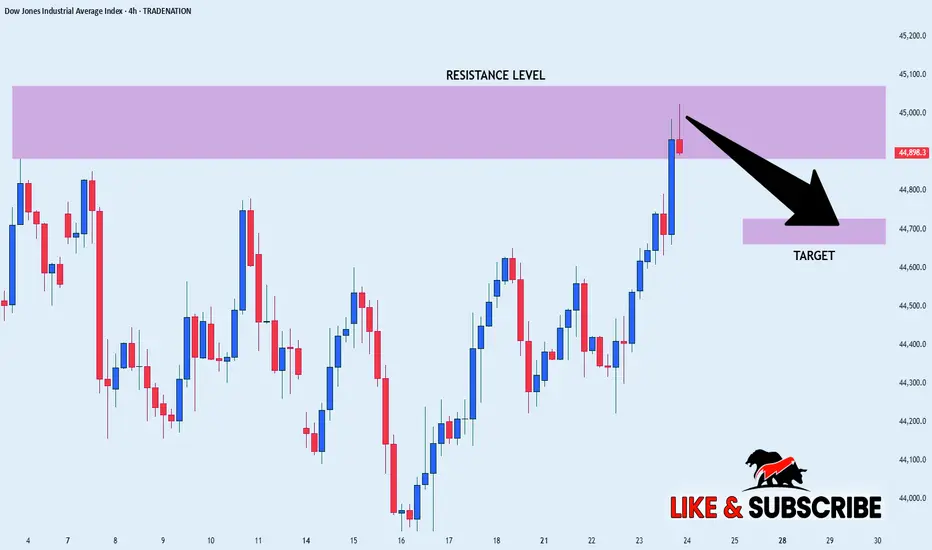
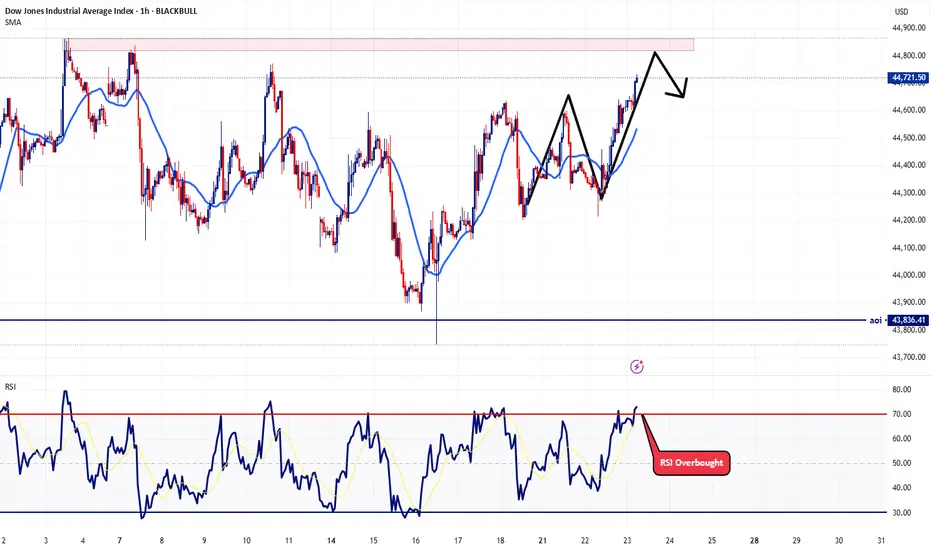
US30 SHORT FORM RESISTANCE|
✅DOW JONES index keeps
Growing in a strong uptrend
And we are bullish biased long-term
However the price has hit an all-time-high
Resistance level of 45,072(which can be seen
Further left you zoom out on higher TF)
So as we are already seeing a local
Bearish reaction we will be
Expecting a local bearish correction
SHORT🔥
✅Like and subscribe to never miss a new idea!✅
Disclosure: I am part of Trade Nation's Influencer program and receive a monthly fee for using their TradingView charts in my analysis.
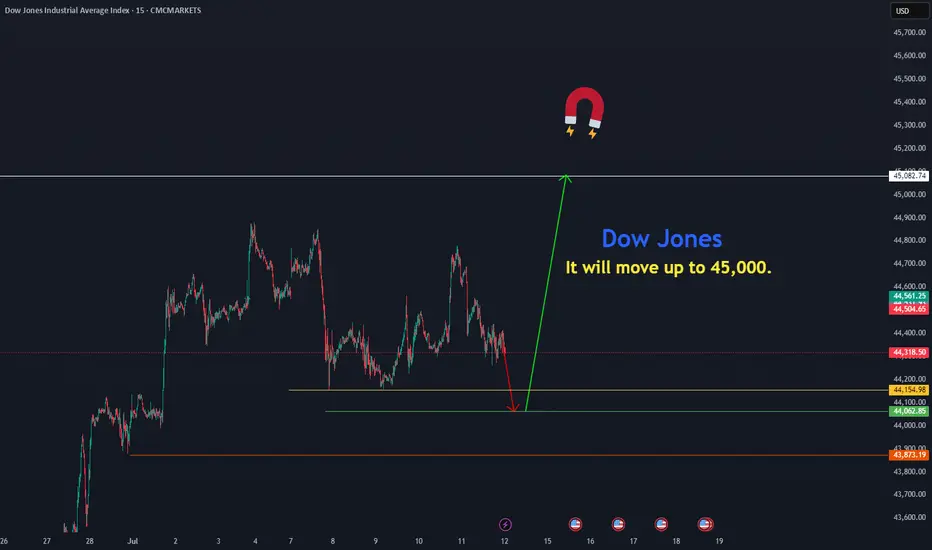
Dow Jones move upThe Dow Jones is resuming its rally toward 45,082 from the price zones of 44,154.97 and 44,000.
CMCMARKETS:US30
US30 Massive Bullish Breakout!
HI,Traders !
#US30 is trading in a strong
Uptrend and the price just
Made a massive bullish
Breakout of the falling
Resistance line and the
Breakout is confirmed
So after a potential pullback
We will be expecting a
Further bullish continuation !
Comment and subscribe to help us grow !

US30 - What I believe will happen todayConsidering today is now Wednesday and Wednesday's have a consistency of being one of those off days. Primarily because usually there are Fed speeches on this day that manipulate the market. With that said, I'm expecting price action to play out how I plotted the arrows on the chart. I believe there is still some further upside for today but then I believe we might get that intraday correction around 11:am - noon EST.
Let's see how today plays out. Trade safe
US30 US30 maintains a bullish outlook, supported by improving economic data, rotation into industrials and value stocks, and resilient corporate earnings. As long as price holds above key support levels, the broader uptrend remains intact.
US30 Dow Jones New All Time HIGHMost people over complicate things, mostly the idea is right in front of you yet most don't believe in what they trade; simple bull flag, simple new ATH, that's it. believe it.
US30 | Inverted Hammer at Key Supply Zone – Reversal or BreakoutUS30 just printed an inverted hammer on the 4H at a major supply zone (44,550–44,600). This is a critical decision point:
✅ Bearish Case:
If price rejects and closes back below 44,530, sellers could take control with targets at 44,380 → 44,180 → 44,020.
✅ Bullish Fakeout:
If price breaks and holds above 44,620, expect a push toward 44,700 and 44,900.
📌 What I’m Watching:
Rejection candle + bearish close → short entries.
Strong breakout candle with retest → long continuation.
Key Levels:
🔴 Resistance: 44,550–44,600
🟢 Support: 44,380 → 44,020
⚠️ Manage risk carefully. Volatility is high and liquidity hunts are common in this zone.
💬 Do you think we reject here or break out higher? Drop your thoughts below!
#US30 #DowJones #PriceAction #SmartMoney #TradingView #TechnicalAnalysis #IndicesTrading
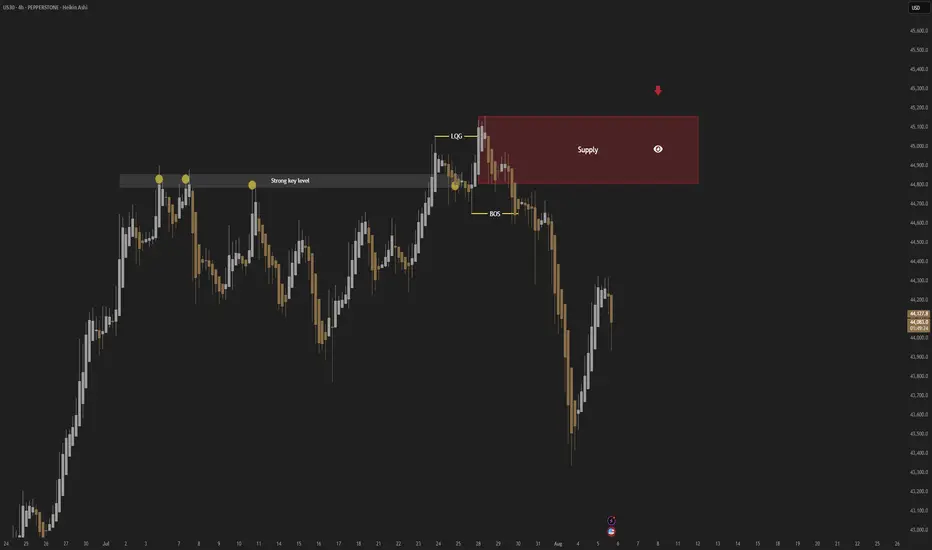
US30; Heikin Ashi Trade Idea📈 Hey Traders!
Here’s a fresh outlook from my trading desk. If you’ve been following me for a while, you already know my approach:
🧩 I trade Supply & Demand zones using Heikin Ashi chart on the 4H timeframe.
🧠 I keep it mechanical and clean — no messy charts, no guessing games.
❌ No trendlines, no fixed sessions, no patterns, no indicator overload.
❌ No overanalyzing market structure or imbalances.
❌ No scalping, and no need to be glued to the screen.
✅ I trade exclusively with limit orders, so it’s more of a set-and-forget style.
✅ This means more freedom, less screen time, and a focus on quality setups.
✅ Just a simplified, structured plan and a calm mindset.
💬 Let’s Talk:
💡Do you trade supply & demand too ?
💡What’s your go-to timeframe ?
💡Ever tried Heikin Ashi ?
📩 Got questions about my strategy or setup? Drop them below — ask me anything, I’m here to share.
Let’s grow together and keep it simple. 👊

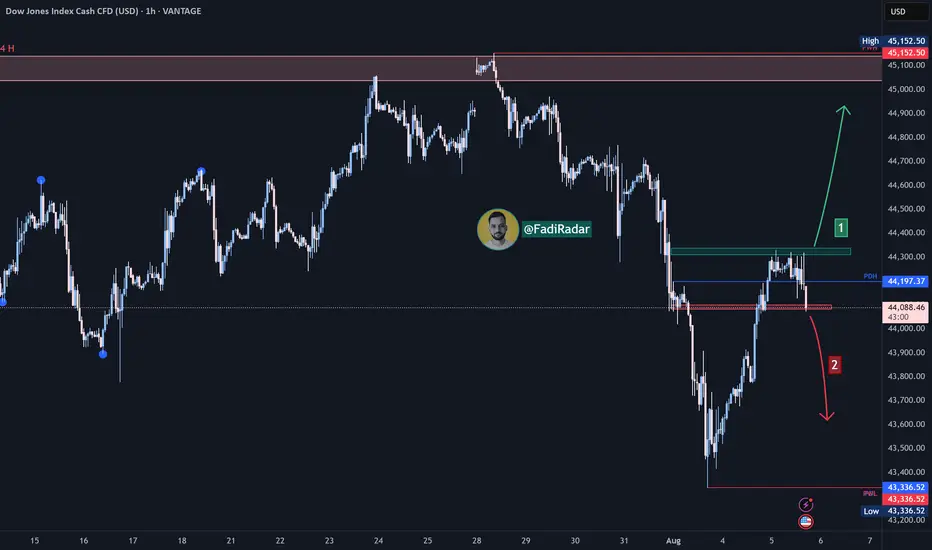
Dow Jones Index (US30) Technical Analysis:The Dow Jones is currently trading near $44,100, after a strong bullish move that failed to break through the $44,300 resistance zone.
🔹 Bearish Scenario:
If the price breaks below $44,000 and holds, it may head toward the $43,350 support level.
🔹 Bullish Scenario:
If bullish momentum returns and the price breaks above $44,300, the next target may be around $45,100.
⚠️ Disclaimer:
This analysis is not financial advice. It is recommended to monitor the markets and carefully analyze the data before making any investment decisions.
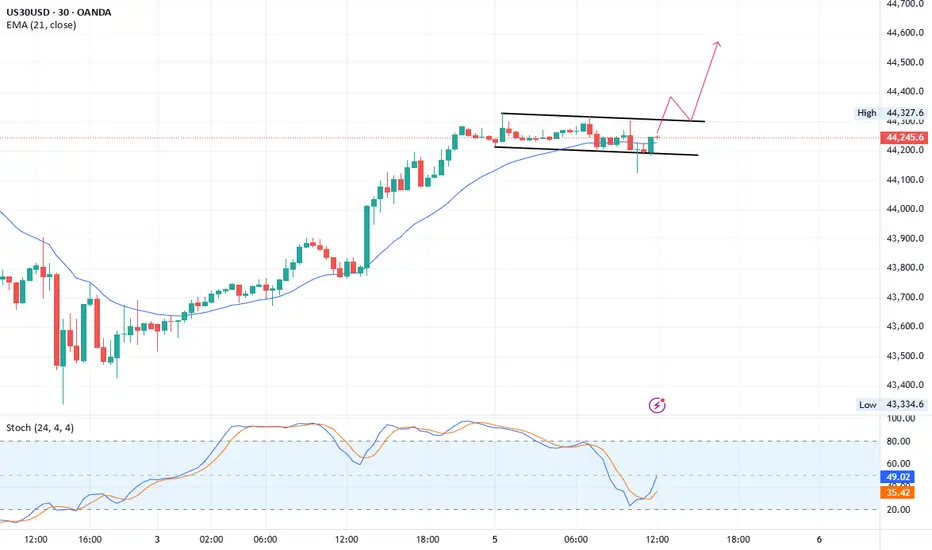
US30 Bullish flag patternUS30
M30 chart bullish flag pattern
Buy: current rate 44238
Stop Loss: 44125
1st TP: 44388
2nd TP: 44570