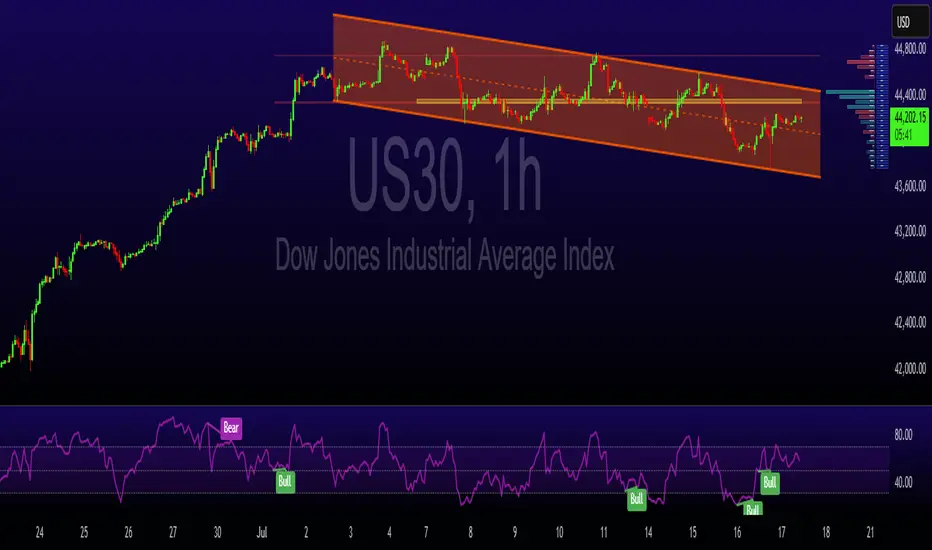
Quick take on DJIACurrently, the Dow Jones Industrial Average TVC:DJI is trading within a short-term downside channel. However, could it just be part of a correction, before another possible leg of buying? Let's dig in.
MARKETSCOM:US30
Let us know what you think in the comments below.
Thank you.
75.2% of retail investor accounts lose money when trading CFDs with this provider. You should consider whether you understand how CFDs work and whether you can afford to take the high risk of losing your money. Past performance is not necessarily indicative of future results. The value of investments may fall as well as rise and the investor may not get back the amount initially invested. This content is not intended for nor applicable to residents of the UK. Cryptocurrency CFDs and spread bets are restricted in the UK for all retail clients.
DJI trade ideas

US30 Update – 07/18/2025📍 US30 Update – 07/18/2025
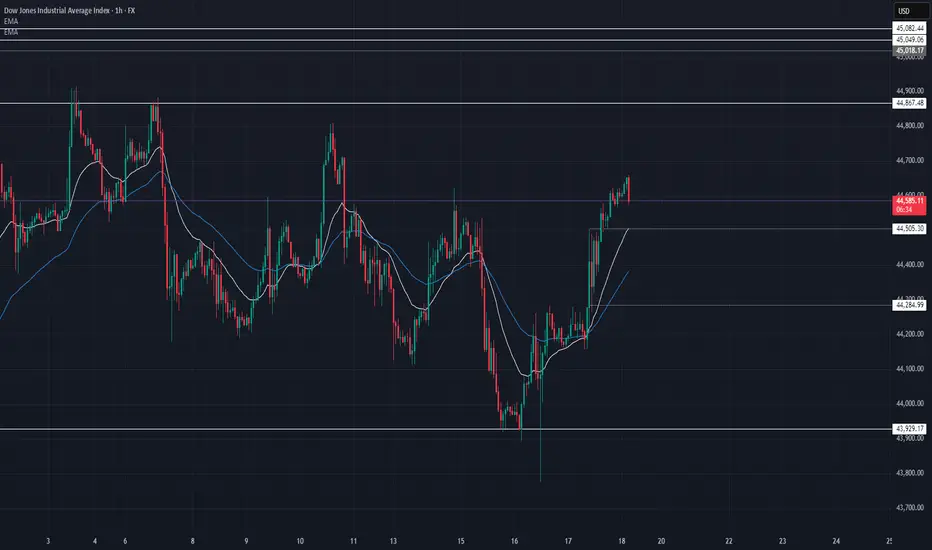
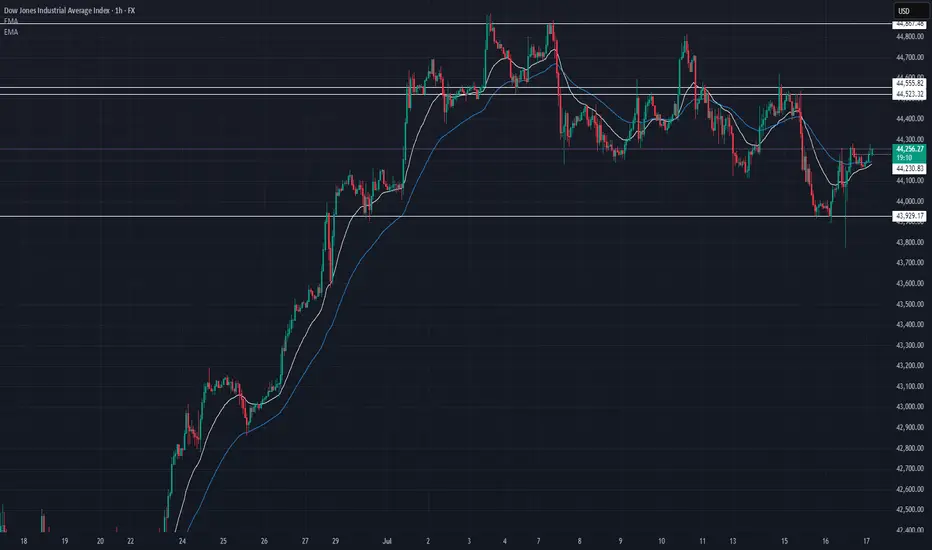
Massive recovery off 43,929 👀
US30 has broken above the 44,500 resistance and is holding strong around 44,590. The EMAs are now sloping bullish on the 1H — this is the first solid bullish structure since the early July top.
If buyers hold above 44,500, we could see a run to retest 44,867, the local high.
📊 Market Structure:
🔄 Bear trend possibly shifting → early signs of reversal
📈 Higher lows forming — EMAs crossed bullish
🔼 Break of 44,505 confirmed strength
🧭 Eyes now on 44,700–44,867 zone
🔑 Key Levels:
🔼 Resistance: 44,700 → 44,867
🔽 Support: 44,505 → 44,285 → 43,929
🧠 Market Bias:
Short-term bullish — but buyers must defend 44,500.
A drop below 44,285 would invalidate this move.
💡 Trade Ideas:
🔼 Long Setup – Continuation:
Entry: Pullback to 44,505–44,530
TP1: 44,700
TP2: 44,850
SL: Below 44,450
🔻 Short Setup – Fade Rejection:
Entry: Rejection at 44,700–44,850
TP1: 44,500
TP2: 44,300
SL: Above 44,900
⚠️ Patience — wait for clean retests or candle rejections at key levels. No need to force entries.
Dow Jones: Shaking amid rumors of Powell’s dismissalIon Jauregui – Analyst at ActivTrades
The main Wall Street indices closed Thursday’s session with mixed results. Comments from Trump stating he had no plans to fire Powell but “doesn’t rule anything out” except in cases of fraud, along with Powell’s declaration that he will serve his full term until mid-2026, pressured the market. The U.S. market has been dealing with these dismissal tensions for seven months, which made the Dow Jones appear weaker, while the S&P 500 and Nasdaq managed to stay in positive territory, supported by strong earnings from key companies. At the session’s start, the Dow Jones fell 0.09% to 44,202 points, while the S&P 500 rose 0.04% to 6,266 points and the Nasdaq gained 0.17% to 20,777 points. However, the Dow Jones closed at 44,484.49 points (+0.52%), the S&P 500 at 6,297.36 points (+0.54%), and the Nasdaq at 20,885.65 points (+0.75%). The day was marked by rumors from the White House, where an official stated that Trump would “probably soon” fire Jerome Powell. The news triggered an intraday drop of over 260 points in the Dow Jones, although markets later moderated losses after clarifications from the former president himself.
An early dismissal of Powell would likely impact the market very negatively and generate significant chaos. Trump’s interest in pressuring the Fed for rate cuts, although he cannot legally dismiss the central bank’s president, has been on the table since the start of his term. This has caused pronounced volatility movements. Meanwhile, the 10-year U.S. Treasury yield fell to 4.449%, as the market reduced the probability of a rate cut in September from 66% to 55% (CME FedWatch).
On the macroeconomic front, June retail sales rose 0.6%, far exceeding the expected 0.1%. Weekly jobless claims stood at 221,000, also below expectations. With these results, Trump has little leverage to challenge the Fed.
Notable corporate results:
PepsiCo surprised positively with EPS of $2.12 (vs. $2.03 expected) and rose 5.7% at the open.
United Airlines advanced 3.6%, beating earnings expectations with EPS of $3.87, although revenues slightly disappointed.
GE Aerospace raised its 2025 EPS forecast to a range of $5.60–5.80, driven by strong aftermarket demand.
Netflix reported after the close, with expectations of $7.09 EPS and $11.06 billion in revenue.
TSMC led chip sector gains, rising more than 3% after announcing record profits thanks to AI. AMD, NVIDIA, and Super Micro also traded higher.
Technical Analysis
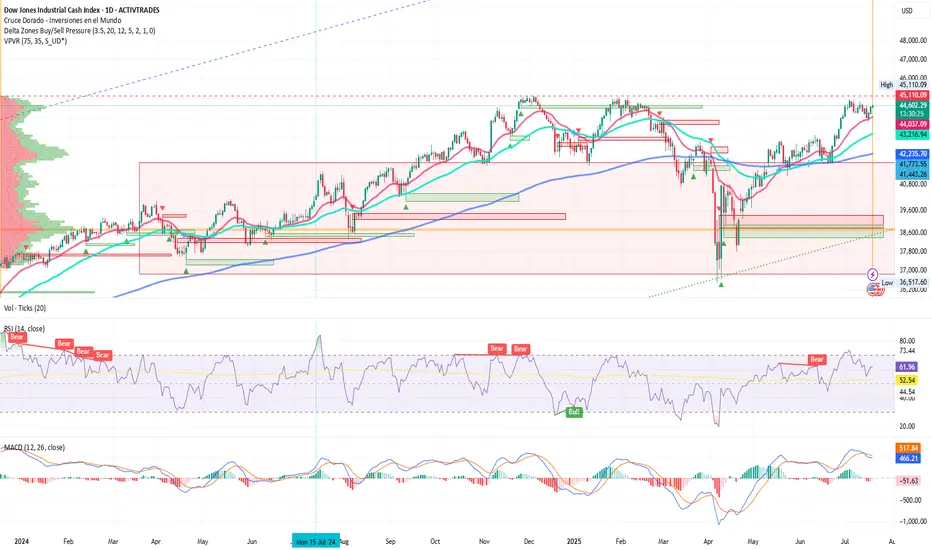
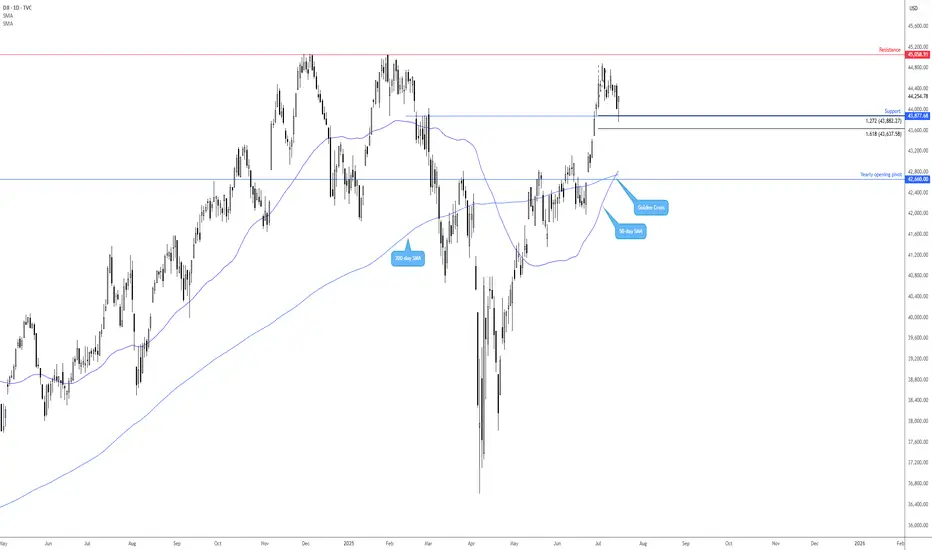
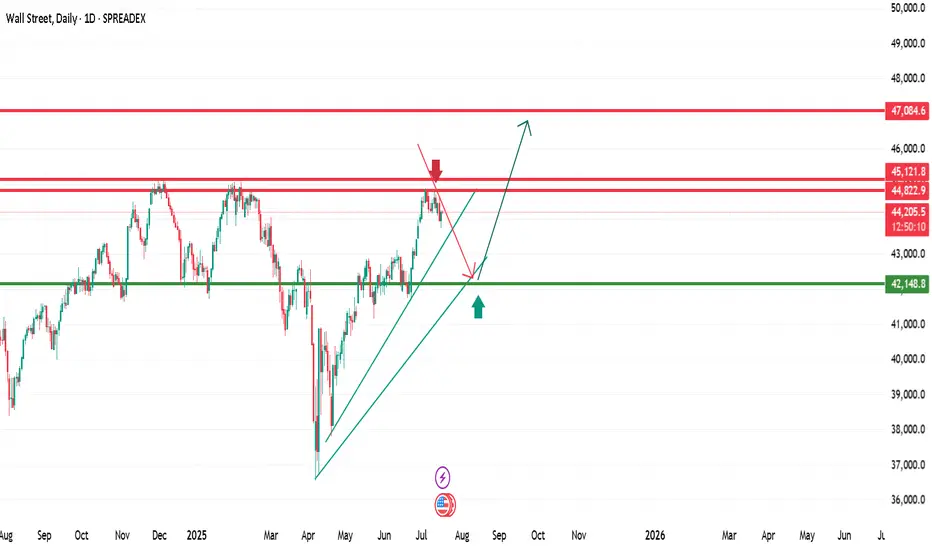
Observing the Dow Jones daily chart (Ticker AT: USAIND), since late April the index has moved upward toward its long-term control zone around 42,230 points, where the Point of Control (POC) acts as support for the current rally. In recent days, candles have used the 50-day moving average as support. The price expansion that began on June 6 with a golden cross appears solid. The bullish delta pressure zones from February and last year’s Christmas rally coincide with the current trading zone, suggesting a potential fourth attempt to break the current all-time highs at 45,110.09 points in pursuit of 46,000. If this price area is not breached, a pullback toward the POC zone could occur, and if that level fails to hold, a drop toward 39,600 points may follow.
*******************************************************************************************
La información facilitada no constituye un análisis de inversiones. El material no se ha elaborado de conformidad con los requisitos legales destinados a promover la independencia de los informes de inversiones y, como tal, debe considerarse una comunicación comercial.
Toda la información ha sido preparada por ActivTrades ("AT"). La información no contiene un registro de los precios de AT, o una oferta o solicitud de una transacción en cualquier instrumento financiero. Ninguna representación o garantía se da en cuanto a la exactitud o integridad de esta información.
Cualquier material proporcionado no tiene en cuenta el objetivo específico de inversión y la situación financiera de cualquier persona que pueda recibirlo. La rentabilidad pasada y las estimaciones no sinónimo ni un indicador fiable de la rentabilidad futura. AT presta un servicio exclusivamente de ejecución. En consecuencia, toda persona que actúe sobre la base de la información facilitada lo hace por su cuenta y riesgo. Los tipos de interés pueden cambiar. El riesgo político es impredecible. Las acciones de los bancos centrales pueden variar. Las herramientas de las plataformas no garantizan el éxito.
US30"Given the downward trend line formed on the one-hour chart, I expect the price to react in the area I’ve marked in blue and then move downward."

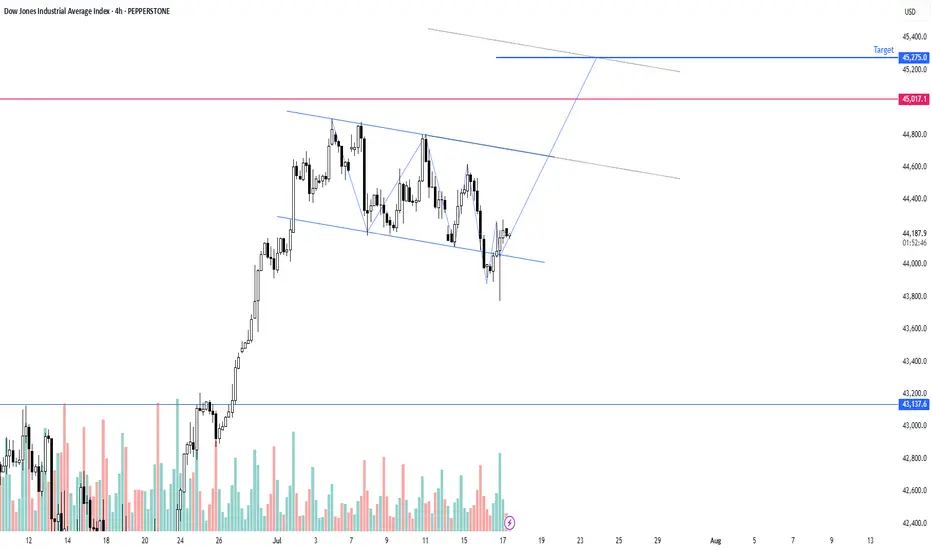
Dow Eyes 45000 After Bullish BreakoutThe U.S. 30 contract has broken topside from a short-term bull flag, reinforcing the broader uptrend and putting 45000 resistance back in focus.
Traders looking to play a continuation can consider longs with a tight stop beneath for protection. A break of 45000 may trigger a fresh burst of upside momentum, putting big figures above in play.
Bullish price momentum is also building again, adding to the case for upside.
Good luck!
DS

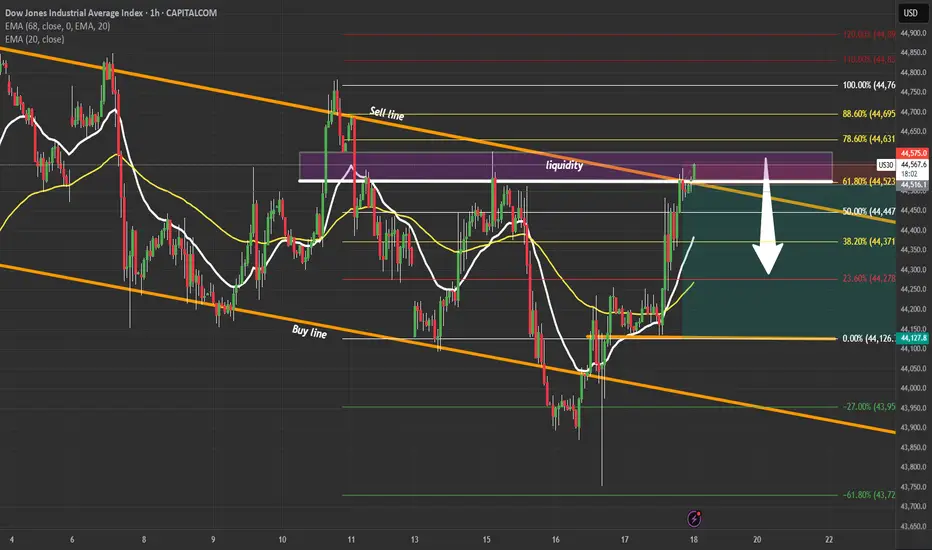
US30 High-Probability Short SetupUS30 | Liquidity Grab at 61.8% Fib 🔍
Price tapped a major liquidity zone inside the descending channel near the 61.8% Fibonacci level.
Plan: Waiting for confirmation to short toward 44,150.
Breakout or rejection? Drop your thoughts below!
Part 2 Overview of Market Week 13-19Thanks for tuning in guys, giving my knowledge to you guys free cause. AU,UJ,EU market overview mixing in a lot of fundamental confirmation.

SellRejection Level
Daily Volume
Market Structure Shift
London Session
Trend Line Break
Untapped Order Point

SellRejection Level
Daily Volume
Market Structure Shift
London Session
Trend Line Break
Untapped Order Point
US30 | Bearish Pressure Builds Below 44,170 — Breakout or BounceUS30: Eyes on Earnings and News
US stocks edged higher pre-market after Trump denied plans to fire Fed Chair Powell, easing market concerns. With corporate earnings in focus, sentiment remains cautiously optimistic.
Technical View:
The price holds bullish momentum above 44170, targeting 44280 and 44500.
A 1H close below 44170 may lead to a drop toward 44075, and breaking below that would open the path to 43960 and 43630.
A 1H close above 44280 strengthens the bullish case toward 44500.
Key Levels:
Resistance: 44280, 44410, 44500
Support: 44075, 43960, 43630
previous idea:

Dow offering buyers much to work with!The Dow Jones Industrial Average (DOW) is clearly trending higher, pencilling in a series of higher highs and higher lows. Supporting this trend is the 50-day simple moving average (SMA) at 42,816 crossing above the 200-day SMA at 42,749; this is referred to as a ‘Golden Cross’ and suggests a longer-term uptrend may be on the table.
This, coupled with the recent ‘alternate’ AB=CD bullish formation (1.272% Fibonacci projection ratio) completing at support from 43,877, has already seen buyers step in (with stops potentially located south of the 1.618% Fibonacci projection ratio of 43,637). The next upside objective from here rests around resistance at 45,058, closely shadowed by the all-time high of 45,073.
Written by the FP Markets Research Team
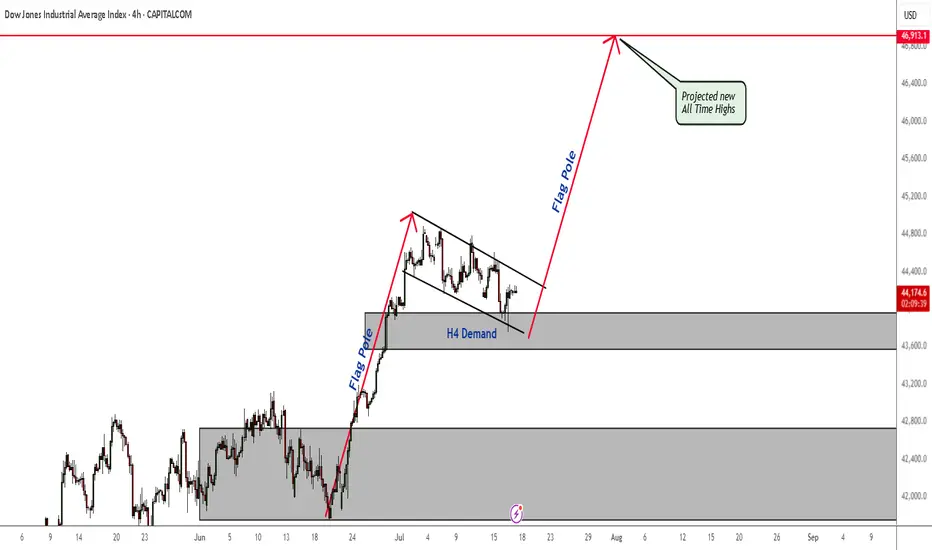
US30 Bullish Flag - All Time Highs The plan for Dow Jones has not changed. Price is still in an H4 demand zone. As soon as price breaks out of this bull flag, nothing will stop the bull run and new All Time Highs being claimed.
Don't miss it.
Sonarlab Sessions: The Best Indicator!!Sonarlab Sessions allows you to edit and craft the different sessions on your chart. Using this tool and indicator allows you to decide what time you would like to get into the market. This allows to frame set ups and rules around that specific session.

Bulls Steady Ahead of Key Earnings and Economic DataU.S. equities are holding steady in what has been a week of conflicting signals. President Trump’s aggressive stance on trade, including potential 30% tariffs on EU and Mexican goods, has shaken market sentiment, but his public commitment to retain Jerome Powell as Fed Chair brought some temporary relief. That stability, at least for now, is helping underpin stock indices.
Focus has now turned to corporate earnings, with key players like TSMC and Netflix reporting shortly. These names could set the tone for the broader Q2 earnings season. At the same time, traders are closely monitoring incoming U.S. data — including retail sales and jobless claims — to gauge the health of the consumer and labor market. The combination of strong earnings and resilient macro data could provide the momentum
Technical Structure:
• Resistance: 44,350 — a potential breakout point
• Support: 44,000 and 43,800
• Pattern: The index is trading within a descending channel, but recent strength suggests a breakout may be developing.
• Upside potential: If earnings and macro data support risk appetite, a breakout toward 44,800 becomes plausible.
Takeaway: Sentiment remains fragile but stable. Traders should keep a close eye on both corporate results and macro data releases for direction cues.
The trend has decreasedAt the moment, the trend has decreased, it will probably fall to the bottom of the pivot daily, and then it will rise and continue to fall to the bottom of the pivot for the first week
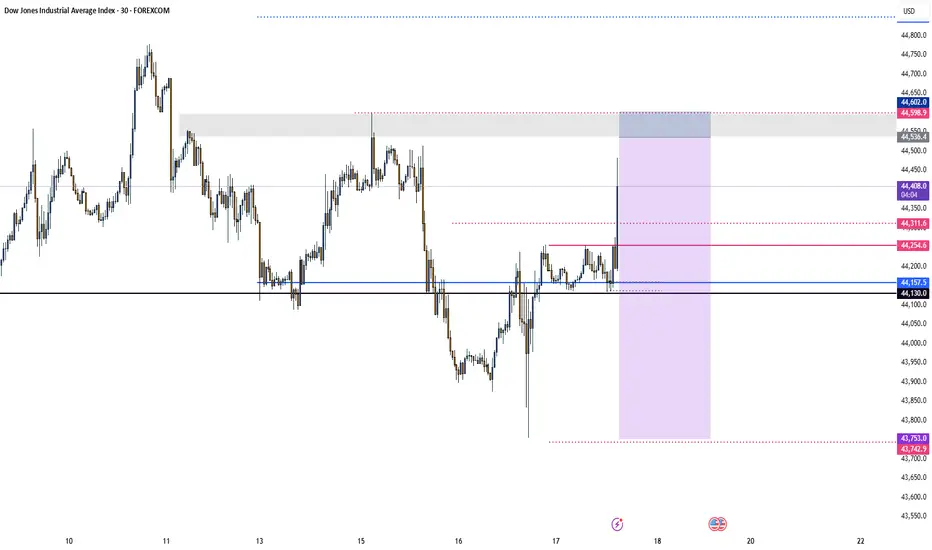
DOW JONES 1H ANALYSIS – JULY 17, 2025📉 DOW JONES 1H ANALYSIS – JULY 17, 2025
🔎 Tracking structure | key levels | trade ideas
🔹 Current Price: 44,248
📆 Timeframe: 1H
📈 Bias: Neutral → Short-term bullish ✅
📌 MARKET STRUCTURE UPDATE:
Price held strong at 43,929 – key support from earlier July lows 🔁
After a deep pullback from 44,800s, we’re seeing a bounce with price reclaiming the 21 & 50 EMA 🧠
This signals short-term buyer momentum stepping in – but caution: we’re still trading below key resistance 👀
🔹 KEY LEVELS TO WATCH:
Support:
🟢 43,929 → major bounce zone (held)
🟢 44,182 → short-term EMA support
Resistance:
🔴 44,523 → former support, now flipped resistance
🔴 44,555 → breakdown origin
🔴 44,857 → major supply zone top
💡 TRADE SCENARIOS:
🔼 Bullish Case:
If price holds above 44,200 and pushes through 44,523–44,555, we likely see 44,700+ retest 🔥
A breakout + hold above 44,555 = trend shift confirmed 📈
🔽 Bearish Case:
If rejection at 44,523/555 holds, watch for rotation back to 44,000 → 43,929
Below 43,929 = possible slide to 43,700–43,600 demand 🚨
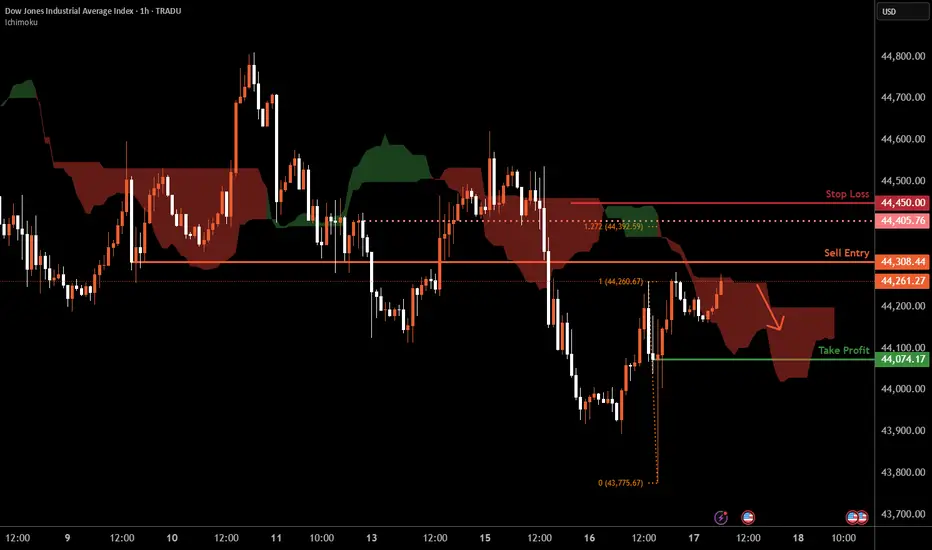
Dow Jones H1 | Approaching a pullback resistanceThe Dow Jones (US30) is rising towards a pullback resistance and could potentially reverse off this level to drop lower.
Sell entry is at 44,308.44 which is a pullback resistance.
Stop loss is at 44,450.00 which is a level that sits above an overlap resistance and the 127.2% Fibonacci extension.
Take profit is at 44,074.17 which is a swing-low support.
High Risk Investment Warning
Trading Forex/CFDs on margin carries a high level of risk and may not be suitable for all investors. Leverage can work against you.
Stratos Markets Limited (tradu.com ):
CFDs are complex instruments and come with a high risk of losing money rapidly due to leverage. 66% of retail investor accounts lose money when trading CFDs with this provider. You should consider whether you understand how CFDs work and whether you can afford to take the high risk of losing your money.
Stratos Europe Ltd (tradu.com ):
CFDs are complex instruments and come with a high risk of losing money rapidly due to leverage. 66% of retail investor accounts lose money when trading CFDs with this provider. You should consider whether you understand how CFDs work and whether you can afford to take the high risk of losing your money.
Stratos Global LLC (tradu.com ):
Losses can exceed deposits.
Please be advised that the information presented on TradingView is provided to Tradu (‘Company’, ‘we’) by a third-party provider (‘TFA Global Pte Ltd’). Please be reminded that you are solely responsible for the trading decisions on your account. There is a very high degree of risk involved in trading. Any information and/or content is intended entirely for research, educational and informational purposes only and does not constitute investment or consultation advice or investment strategy. The information is not tailored to the investment needs of any specific person and therefore does not involve a consideration of any of the investment objectives, financial situation or needs of any viewer that may receive it. Kindly also note that past performance is not a reliable indicator of future results. Actual results may differ materially from those anticipated in forward-looking or past performance statements. We assume no liability as to the accuracy or completeness of any of the information and/or content provided herein and the Company cannot be held responsible for any omission, mistake nor for any loss or damage including without limitation to any loss of profit which may arise from reliance on any information supplied by TFA Global Pte Ltd.
The speaker(s) is neither an employee, agent nor representative of Tradu and is therefore acting independently. The opinions given are their own, constitute general market commentary, and do not constitute the opinion or advice of Tradu or any form of personal or investment advice. Tradu neither endorses nor guarantees offerings of third-party speakers, nor is Tradu responsible for the content, veracity or opinions of third-party speakers, presenters or participants.
US30 in the US stock market will also set a new highUS30 in the US stock market will also set a new high
He is a little slower but will reach the goal
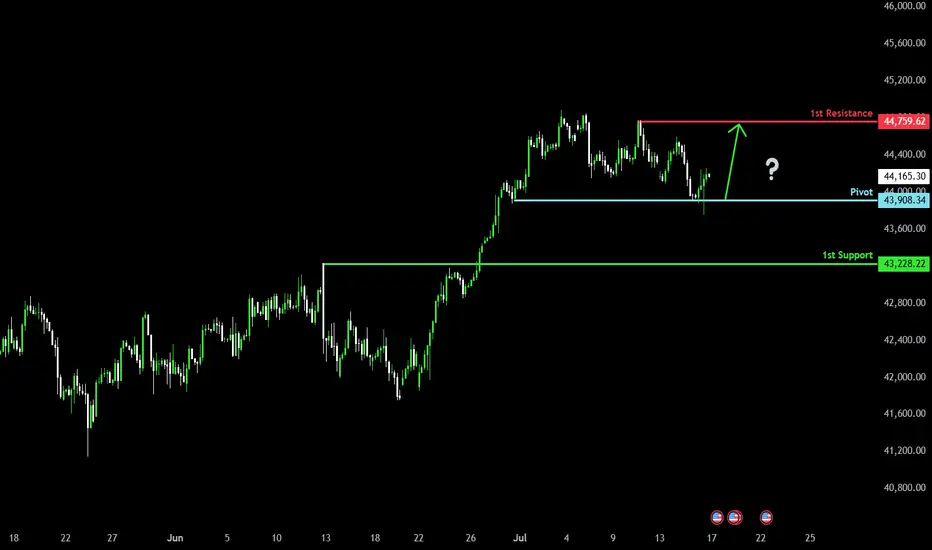
Could the price rise from here?Dow Jones (US30) has bounced off the pivot and could potentially rise to the 1st resistance which acts as a pullback resistance.
Pivot: 43,908.34
1st Support: 43,228.22
1st Resistance: 44,759.62
Risk Warning:
Trading Forex and CFDs carries a high level of risk to your capital and you should only trade with money you can afford to lose. Trading Forex and CFDs may not be suitable for all investors, so please ensure that you fully understand the risks involved and seek independent advice if necessary.
Disclaimer:
The above opinions given constitute general market commentary, and do not constitute the opinion or advice of IC Markets or any form of personal or investment advice.
Any opinions, news, research, analyses, prices, other information, or links to third-party sites contained on this website are provided on an "as-is" basis, are intended only to be informative, is not an advice nor a recommendation, nor research, or a record of our trading prices, or an offer of, or solicitation for a transaction in any financial instrument and thus should not be treated as such. The information provided does not involve any specific investment objectives, financial situation and needs of any specific person who may receive it. Please be aware, that past performance is not a reliable indicator of future performance and/or results. Past Performance or Forward-looking scenarios based upon the reasonable beliefs of the third-party provider are not a guarantee of future performance. Actual results may differ materially from those anticipated in forward-looking or past performance statements. IC Markets makes no representation or warranty and assumes no liability as to the accuracy or completeness of the information provided, nor any loss arising from any investment based on a recommendation, forecast or any information supplied by any third-party.
US30 DOW BULLISH ANALYSIS Triple tops are the next liquidity targets from a fvg support as shown. the tops are week as we have seen NASDAQ and S&P500 hav3 liquidated their highs its. Lear US30 is following the same path.
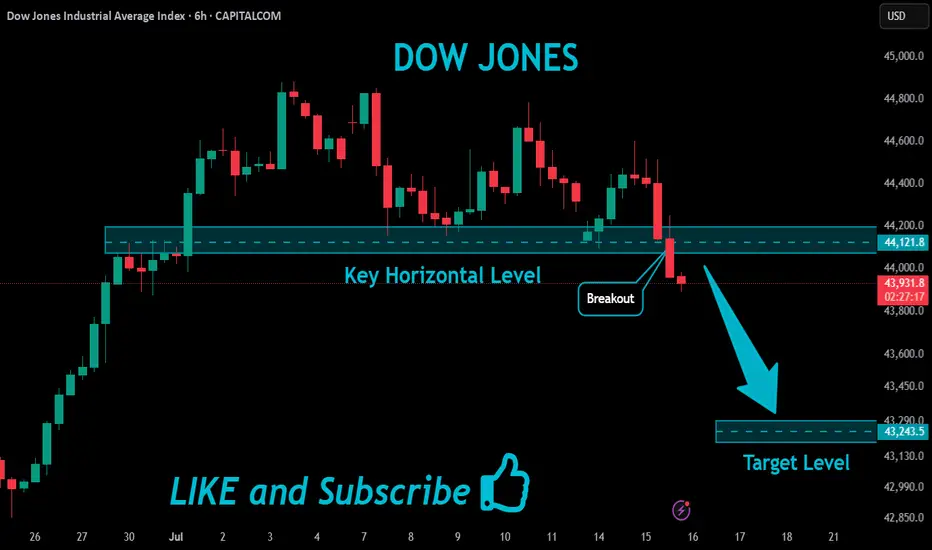
US30 Bearish Breakout!
HI,Traders !
#US30 index is trading in a strong downtrend,
and has broken through the key horizontal
level at 44121.8, reinforcing our bearish
outlook. We expect further declines !
Comment and subscribe to help us grow !
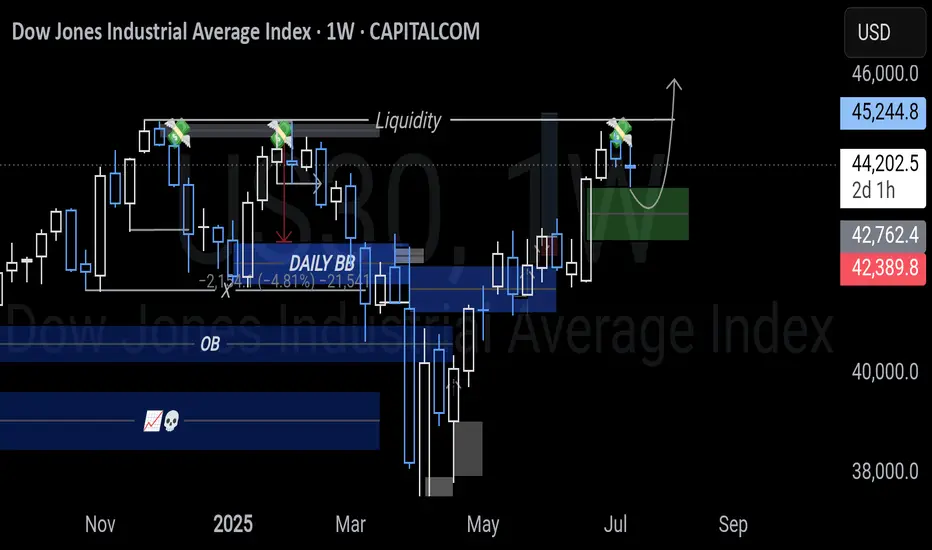
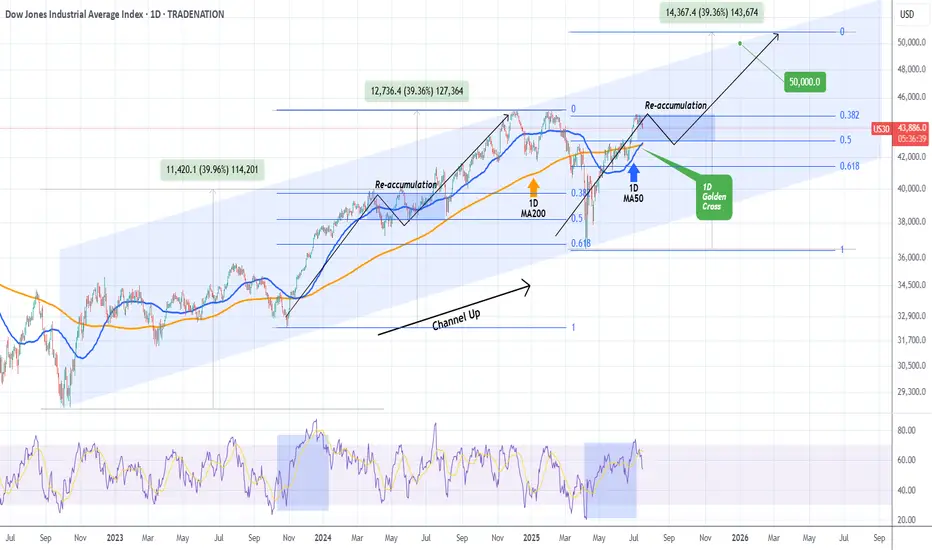
DOW JONES formed 1st 1D Golden Cross since 2022!Dow Jones (DJIA) completed on Monday its 1st Golden Cross on the 1D time-frame since December 12 2022! This powerful bullish pattern comes with the price close to its All Time High (ATH).
Being inside almost a 3-year Channel Up, the current rise is the pattern's latest Bullish Leg following the April 07 2025 bottom (Higher Low). Both previous Bullish Legs rose by +39.96% before forming a Higher High.
Based on the Fibonacci retracement levels, last time the previous Bullish Leg was within the 0.382 - 0.5 Fibonacci Zone, it formed a Re-accumulation Phase for 3 months. As a result, we shouldn't dismiss the fact of trading sideways for the rest of the Summer and then picking up the pace. Our end-of-year Target remains 50000.
-------------------------------------------------------------------------------
** Please LIKE 👍, FOLLOW ✅, SHARE 🙌 and COMMENT ✍ if you enjoy this idea! Also share your ideas and charts in the comments section below! This is best way to keep it relevant, support us, keep the content here free and allow the idea to reach as many people as possible. **
-------------------------------------------------------------------------------
Disclosure: I am part of Trade Nation's Influencer program and receive a monthly fee for using their TradingView charts in my analysis.
💸💸💸💸💸💸
👇 👇 👇 👇 👇 👇
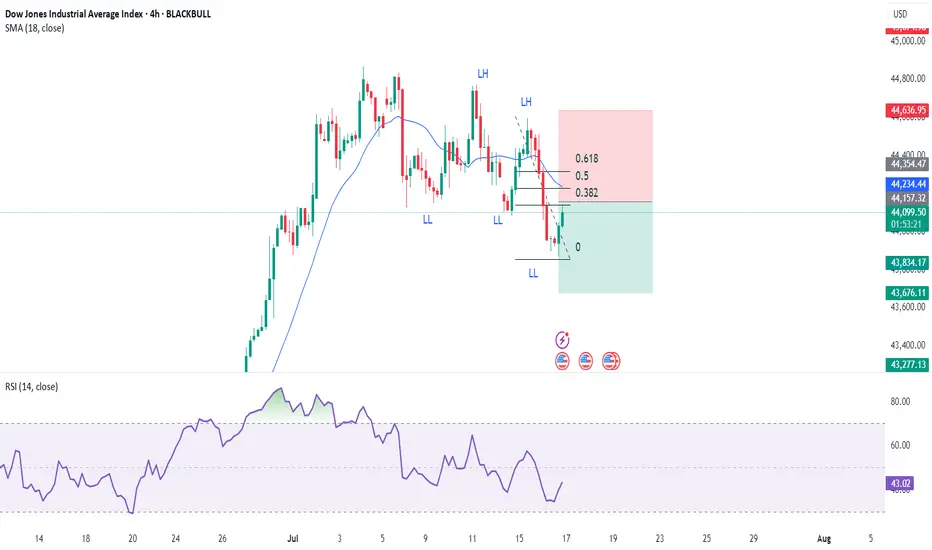
Dow Short IdeaDow jones has started making LL's so it is effectively in a downward trend on 4Hr chart so shorting on pullback to key Fib Retracement levels would be a good idea.